9. Input Devices
Group Assignment
- probe an input device’s analog levels and digital signals
1. Oscilloscope Calibration
Before starting, we calibrated the oscilloscope using its built-in calibration signal (1kHz square wave). We connected the probe tip to the CAL terminal on the front panel and adjusted the probe compensation until the waveform showed a clean square wave with flat tops.
2. LED Blink with a Resistor
We first reviewed how to use an oscilloscope by probing a blinking LED circuit. By placing the probe at two different points — before and after the resistor — we were able to observe two different voltage levels and see how the resistor causes a voltage drop.
Wiring:
- XIAO D10 (GPIO3) → resistor → LED anode (long leg)
- LED cathode (short leg) → GND
How to probe:
- Connect the probe tip to the measurement point
- Connect the probe ground clip to GND
- Press Autoset to automatically adjust the time and voltage scales
MicroPython code:
from machine import Pin
import utime

led = Pin(3, Pin.OUT)  # D10 = GPIO3

while True:
    led.value(1)     # ON
    utime.sleep(1)
    led.value(0)     # OFF
    utime.sleep(1)
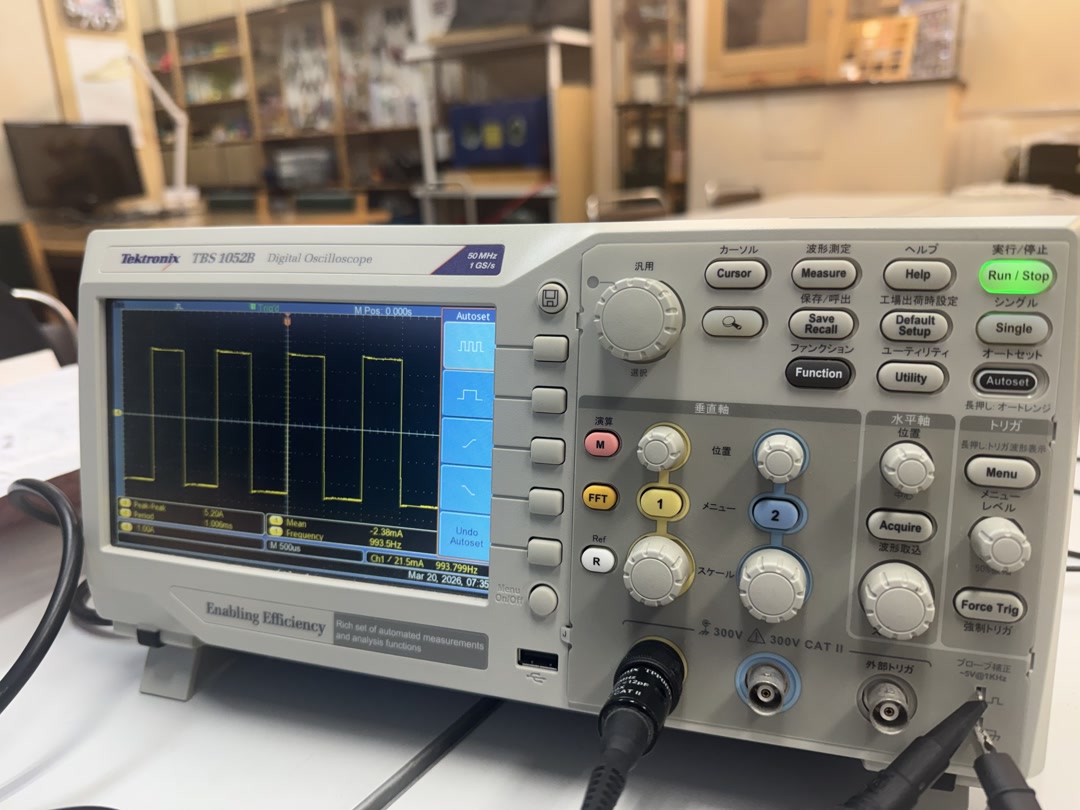
Probing before the resistor (directly at the GPIO pin) showed a clean 3.3V square wave. Probing after the resistor (at the LED anode) showed a lower voltage (~2V) because of the voltage drop across the resistor and LED. This confirmed that the resistor is limiting current as expected.
3. Potentiometer and LED
Next, we built a circuit that controls LED brightness with a potentiometer. This allowed us to probe both an analog input signal (potentiometer output) and a digital PWM signal (LED control) simultaneously.
We asked ChatGPT to write the test code by giving it the wiring schema.
Components:
| Component | Specification |
|---|---|
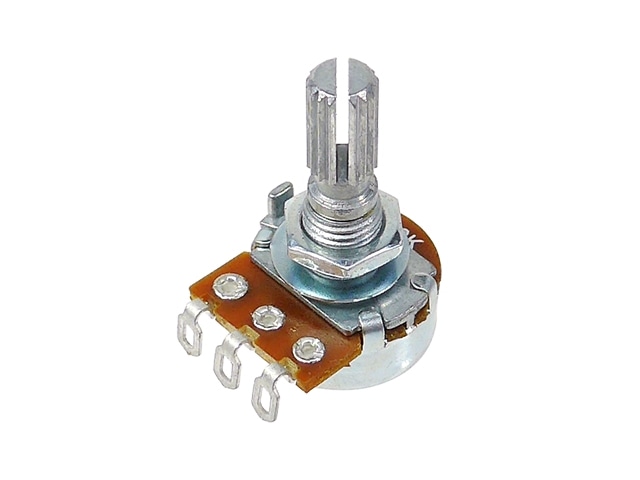
| Potentiometer | 10KΩ type B |
| LED | Standard through-hole LED |
| Resistor | Current limiting resistor |
| Microcontroller | Seeed XIAO RP2040 |
Wiring:
- Potentiometer
- VCC → 3.3V
- GND → GND
- Output → D0 (GPIO26)
- LED
- D10 (GPIO3) → resistor → LED anode (long leg)
- LED cathode (short leg) → GND
ChatGPT prompt:
Given the wiring above, write MicroPython code for the XIAO RP2040 to read the potentiometer value and control the brightness of LED.
MicroPython code:
from machine import Pin, ADC, PWM
import utime

# Potentiometer (D0 = GPIO26)
pot = ADC(Pin(26))

# LED with PWM (D10 = GPIO3)
led = PWM(Pin(3))
led.freq(1000)  # 1kHz PWM frequency

while True:
    # Read ADC value (0–65535)
    adc_val = pot.read_u16()

    # Map ADC value directly to PWM duty cycle (0–65535)
    led.duty_u16(adc_val)

    utime.sleep_ms(10)
Code explanation (in our own words):
The code reads the potentiometer value using the ADC (analog-to-digital converter) on GPIO26. The ADC returns a value between 0 and 65535 depending on the knob position. That same value is passed directly to the PWM duty cycle on GPIO3, which controls how long the LED stays ON within each cycle. At 1kHz frequency, a 50% duty cycle means the LED is ON for 0.5ms and OFF for 0.5ms — too fast to see as flicker, so it appears as half brightness. Rotating the knob from min to max smoothly changes the duty cycle from 0% to 100%, making the LED go from off to full brightness.
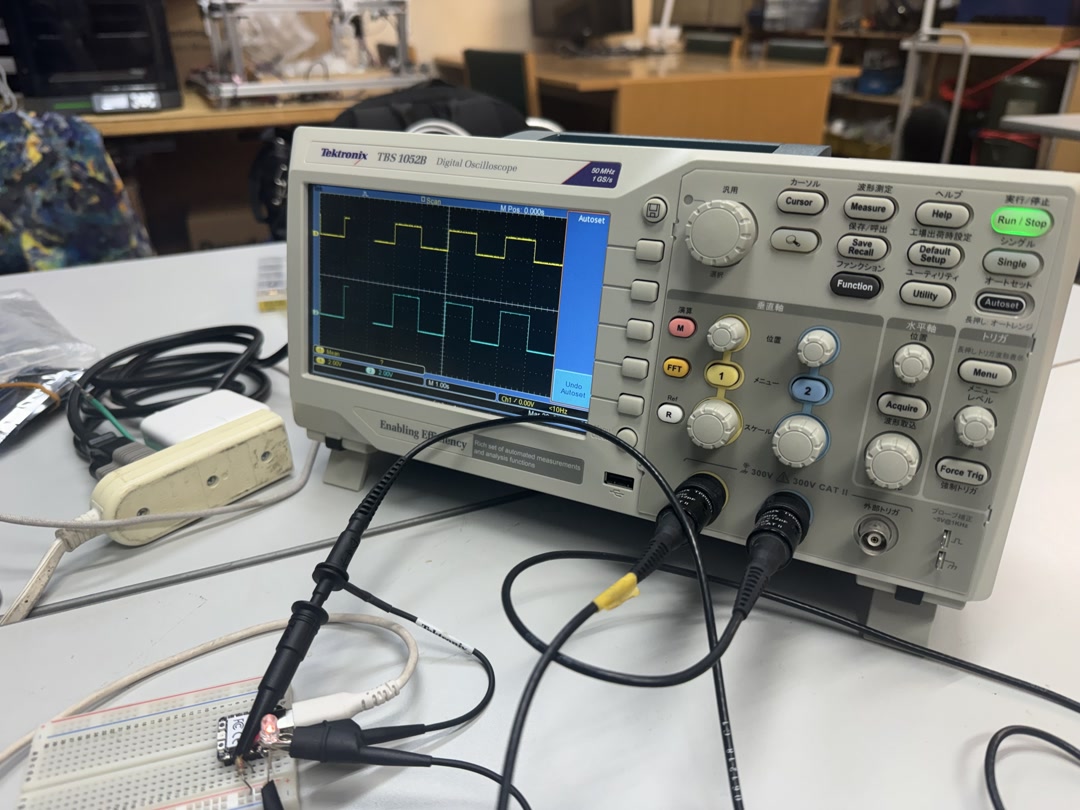
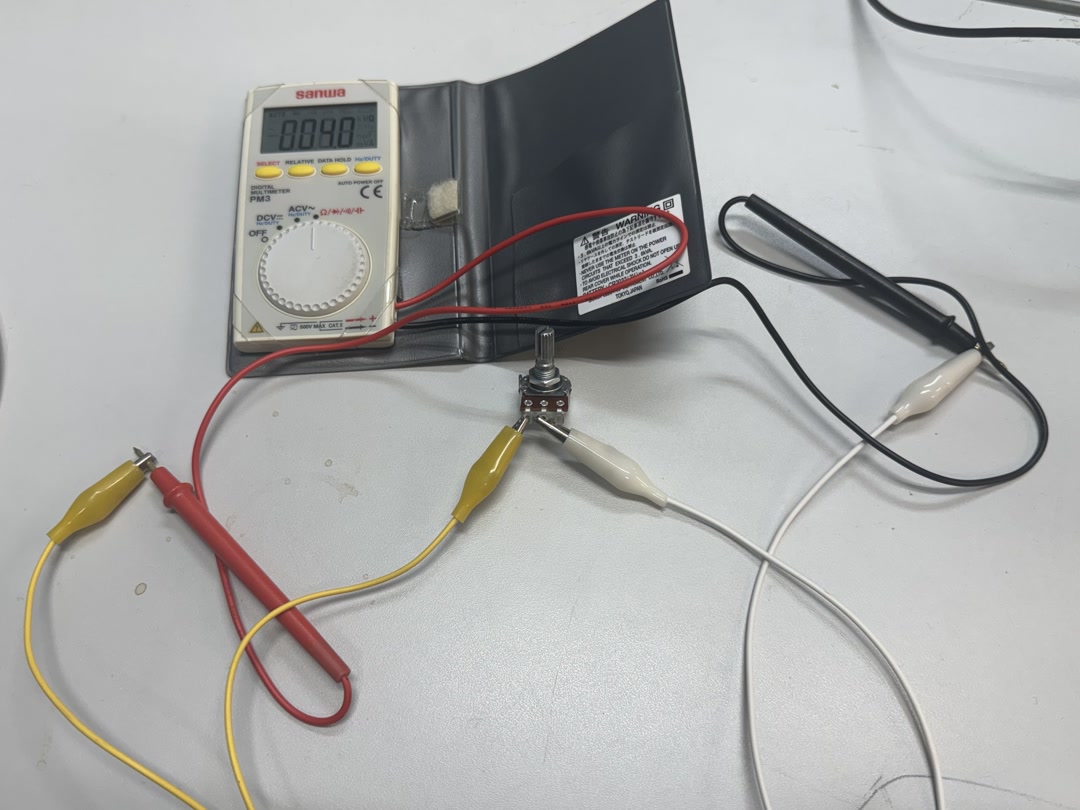
Oscilloscope observations:
When probing the potentiometer output (D0), we observed a steady DC voltage that changed smoothly as we rotated the knob — a classic analog signal. When probing the LED pin (D10), we observed a PWM square wave whose duty cycle changed in response to the potentiometer position.
| Potentiometer position | Analog voltage at D0 | PWM duty cycle at D10 |
|---|---|---|
| High (max) | ~3.3V | ~100% |
| Low (min) | ~0V | ~0% |
Next step: Logic Analyzer
While the oscilloscope let us observe the PWM waveform visually, we realized that to properly measure a digital signal — seeing HIGH/LOW transitions and timing data as digital values — we should use a logic analyzer. We plan to add logic analyzer measurements in a future session.
Note
The XIAO RP2040’s ADC reference voltage is 3.3V, so the potentiometer must be connected to the 3.3V pin (not 5V) to avoid exceeding the ADC input range.
4. More Oscilloscope Usage
We can also use an oscilloscope in the reverse direction to determine what kind of signals our microcontrollers send. Since a TFT display technically has its own processor on board, let’s pretend the XIAO is an input device for this example. We can write some code to increase and decrease the brightness of a backlight over SPI.
import time
import math
import board
import busio
import displayio
import terminalio
import pwmio
from adafruit_display_text import label
from circuitpython_st7796s import ST7796S

print("Starting...")

displayio.release_displays()
spi = busio.SPI(clock=board.D8, MOSI=board.D10, MISO=board.D9)
display_bus = FourWire(spi, command=board.D2, chip_select=board.D3, reset=board.D1)
display = ST7796S(display_bus, width=480, height=320, rotation=0)

splash = displayio.Group()
display.root_group = splash
text_area = label.Label(terminalio.FONT, text="OSCILLOSCOPE TEST", color=0xFFFFFF, scale=3)
text_area.anchor_point = (0.5, 0.5)
text_area.anchored_position = (240, 160)
splash.append(text_area)

backlight = pwmio.PWMOut(board.D6, frequency=1000, duty_cycle=0)

angle = 0.0
speed = 0.05

while True:
    brightness = (math.sin(angle) + 1.0) / 2.0
    backlight.duty_cycle = int(brightness * 65535)

    angle += speed
    if angle > math.pi * 2:
        angle = 0.0

    time.sleep(0.01)
We’re able to wire the oscilloscope to the ground and backlight pin to measure this oscillation. This test was performed with a different oscilloscope in ESAN in Lima, the model is a GDS-11521A-U. Set up was simple. Get it plugged in, attach the lead to COM1, and adjust the volts dial to a suitable range (we’re looking at 0 to 3.3V), then have it record the signal at a suitable threshold (halfway or around 1.52V is good).
AI usage
- ChatGPT for generating the test code.
- Claude Code for brushing up the report.