Week09
group assignment: • probe an input device’s analog levels and digital signals
Probing Analog and Digital Signals of the DFRobot SEN0189 Turbidity Sensor
Turbidity (Water Monitoring) Sensor
The turbidity sensor is a water quality monitoring device used to measure the level of suspended particles in water, which determines how clear or cloudy the water is. It is widely used in environmental monitoring, aquaculture, and smart irrigation systems.
DFRobot SEN0189 Turbidity Sensor (Water Monitoring)
The DFRobot SEN0189 turbidity sensor is used to measure water quality by detecting the level of turbidity in a liquid. It works by measuring the light transmittance and scattering rate in water. These optical changes depend on the amount of total suspended solids (TSS) present in the water.
As the amount of suspended particles increases, the water becomes more cloudy, causing more light to scatter and less light to pass through. This results in an increase in turbidity level.
Working Principle
The sensor detects changes in water clarity by analyzing how light behaves inside the liquid:
- In clean water, more light passes through the medium.
- In turbid water, more light is scattered by suspended particles.
The sensor converts these changes into electrical signals that can be read by a microcontroller.
Output Modes
This turbidity sensor supports both analog and digital output modes:
- The analog output (0–4.5V) provides a continuous voltage that represents the turbidity level.
- The digital output (HIGH/LOW) uses a threshold value that can be adjusted using a potentiometer. When the turbidity crosses this set level, the output changes state.
The mode can be selected depending on the microcontroller application requirements.
Applications
The turbidity sensor is commonly used in:
- Water quality monitoring in rivers and streams
- Wastewater and effluent analysis
- Sediment transport research
- Laboratory water testing and experiments
Specifications
- Model: DFRobot SEN0189
- Operating Voltage: 5V DC
- Operating Current: 40mA (MAX)
- Response Time: < 500 ms
- Insulation Resistance: ≥ 100MΩ
- Analog Output: 0 – 4.5V
- Digital Output: High/Low signal (threshold adjustable via potentiometer)
- Operating Temperature: 5°C to 90°C
- Storage Temperature: -10°C to 90°C
- Weight: 30g
- Adapter Dimensions: 38mm × 28mm × 10mm
Note: The top of the probe is not waterproof and should not be submerged.
The sensor provides two outputs:
- Analog Output (AO) – provides a continuous voltage proportional to the turbidity level.
- Digital Output (DO) – provides a HIGH or LOW signal depending on a threshold set using the onboard potentiometer.
Analog Output Results
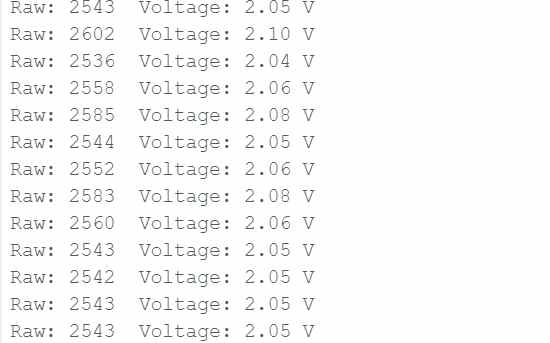
The analog output was measured using a microcontroller’s ADC. Some of the readings obtained were:
The readings remained fairly stable, with voltages ranging between 2.04 V and 2.10 V, giving an average voltage of approximately 2.06 V.
Digital Output Results
Analog Output Results
I prompted chatgpt and generated the code below:
const int turbidityPin = D1;// Change if needed (GPIO2 typical)

void setup() {
  Serial.begin(115200);
  delay(1000);
  Serial.println("Turbidity Sensor Test Starting...");
}

void loop() {
  int sensorValue = analogRead(turbidityPin);
  // Convert to voltage (ESP32 = 3.3V ADC)
  float voltage = sensorValue * (3.3 / 4095.0);

  Serial.print("Raw: ");
  Serial.print(sensorValue);

  Serial.print("  Voltage: ");
  Serial.print(voltage);
  Serial.println(" V");

  delay(1000);
}
When probing the digital output, the measured voltage was approximately 2.4 V. Unlike the analog output, which varies continuously, the digital output is generated by a comparator circuit on the sensor module. The comparator compares the measured turbidity value against a preset threshold and outputs either a HIGH or LOW signal.
The higher voltage observed on the digital output indicates that the sensor output was in a HIGH state during the measurement. This output is intended to indicate whether the turbidity level is above or below the configured threshold rather than provide an exact measurement.
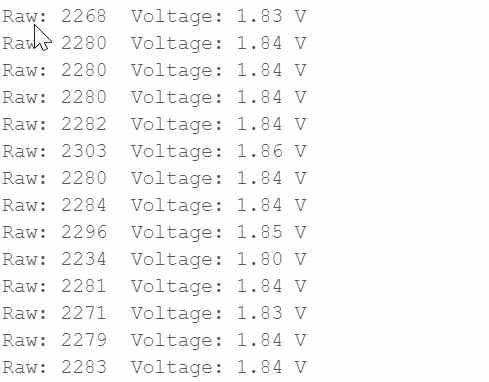
Testing with dirty and clean water
I used chatgpt generated code here;
const int turbidityPin = A2;

float V_clean = 2.77;
float V_dirty = 0.90;

int getAverage() {
  int sum = 0;
  for (int i = 0; i < 20; i++) {
    sum += analogRead(turbidityPin);
    delay(5);
  }
  return sum / 20;
}

void setup() {
  Serial.begin(115200);
  Serial.println("=== TURBIDITY MONITOR ===");
}

void loop() {
  int raw = getAverage();
  float voltage = raw * (3.3 / 4095.0);

  float turbidity = ((V_clean - voltage) / (V_clean - V_dirty)) * 100.0;

  // Clamp values
  if (turbidity < 0) turbidity = 0;
  if (turbidity > 100) turbidity = 100;

  // Classification
  String status;
  if (turbidity < 20) {
    status = "CLEAN 💧";
  }
  else if (turbidity < 50) {
    status = "SLIGHTLY DIRTY 🌫️";
  }
  else if (turbidity < 80) {
    status = "DIRTY 🟤";
  }
  else {
    status = "VERY DIRTY 🚫";
  }

  // Print everything nicely
  Serial.print("Raw: ");
  Serial.print(raw);

  Serial.print(" | Voltage: ");
  Serial.print(voltage, 2);

  Serial.print(" V | Turbidity: ");
  Serial.print(turbidity, 1);
  Serial.print(" %");

  Serial.print(" | Status: ");
  Serial.println(status);

  delay(1000);
}
Lessons Learnt
From this experiment, I learned how the DFRobot SEN0189 turbidity sensor measures water quality using light scattering. I understood how turbidity relates to suspended particles in water.
I also learned the difference between analog and digital outputs: analog gives continuous values, while digital gives simple HIGH/LOW signals based on a threshold.
Challenges
The main challenge was understanding why analog and digital outputs give different readings even from the same sensor.
I also faced small fluctuations in analog readings, which made it difficult to get a stable value. which i changed the sensor to another and it worked for me.
Another challenge was interpreting raw ADC values and adjusting the digital threshold using the potentiometer. I later turned it to the end.
Conclusion
The experiment helped me understand how sensors convert physical changes in water into electrical signals for measurement and control.