Week 14 > Interface and application programming
group assignment: • compare as many tool options as possible
Water Purification IoT Platform
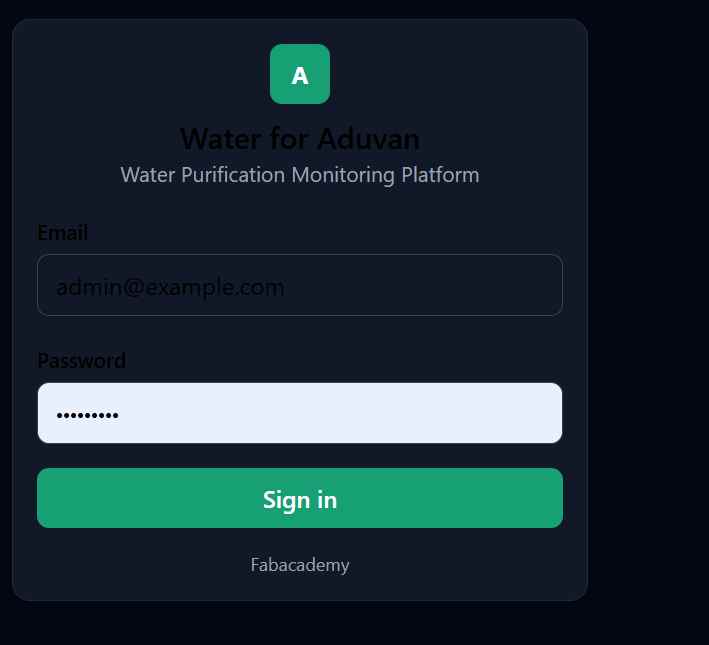
I want to build a production-ready IoT Water Purification Monitoring and Control Platform built using JavaScript, Node.js, Express.js, React, PostgreSQL, Docker, Nginx, and Eclipse Mosquitto MQTT, with ESP32-C3 edge devices for real-time sensing, remote control, secure data management, and analytics. The platform enables scalable monitoring, automated purification control, device management, historical analytics, alerts, OTA updates, and multi-site deployment for schools, hospitals, NGOs, and community water systems.
 Production-style monitoring & control platform for water purification units
built on the Seeed XIAO ESP32-C3.
Production-style monitoring & control platform for water purification units
built on the Seeed XIAO ESP32-C3.
Stack
- Firmware: ESP32-C3 (Arduino), Wi-Fi + MQTT, local buffering, OTA-ready
- Broker: Mosquitto (MQTT)
- Backend: Node.js + Express, REST API, WebSocket, JWT auth, RBAC
- Database: PostgreSQL (normalized schema, auto-applied on first boot)
- Frontend: React (Vite) dashboard, dark/light mode, live + historical data
- Proxy: Nginx (serves frontend, proxies /api and /ws to backend)
- Orchestration: Docker Compose
Technology Stack
Eclipse Mosquitto MQTT
Eclipse Mosquitto was used as the MQTT broker to provide lightweight and reliable communication between the ESP32-C3 devices and the backend server. It enables real-time transmission of sensor data and remote control commands using the publish/subscribe model.
Node.js
Node.js was used to develop the backend server due to its asynchronous and event-driven architecture. It processes device data, executes business logic, manages authentication, and coordinates communication between the database, MQTT broker, and dashboard.
Express.js
Express.js was used to build secure REST APIs for user authentication, device management, sensor data retrieval, alerts, reports, and remote device control. Its modular structure simplifies application development and maintenance.
React
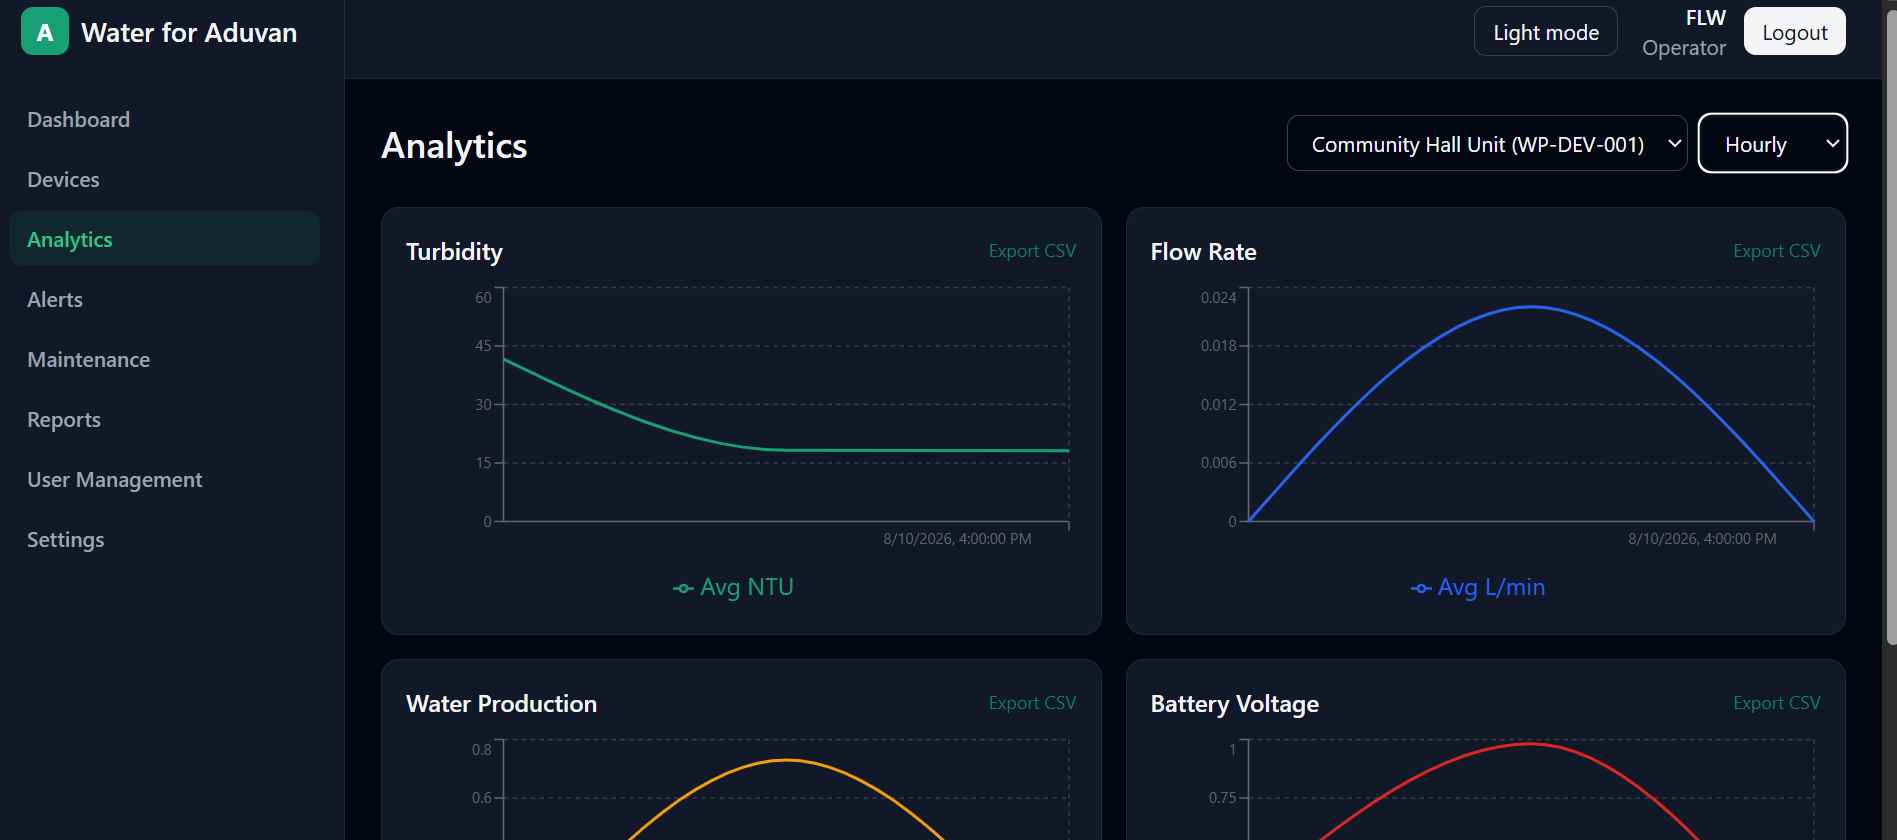
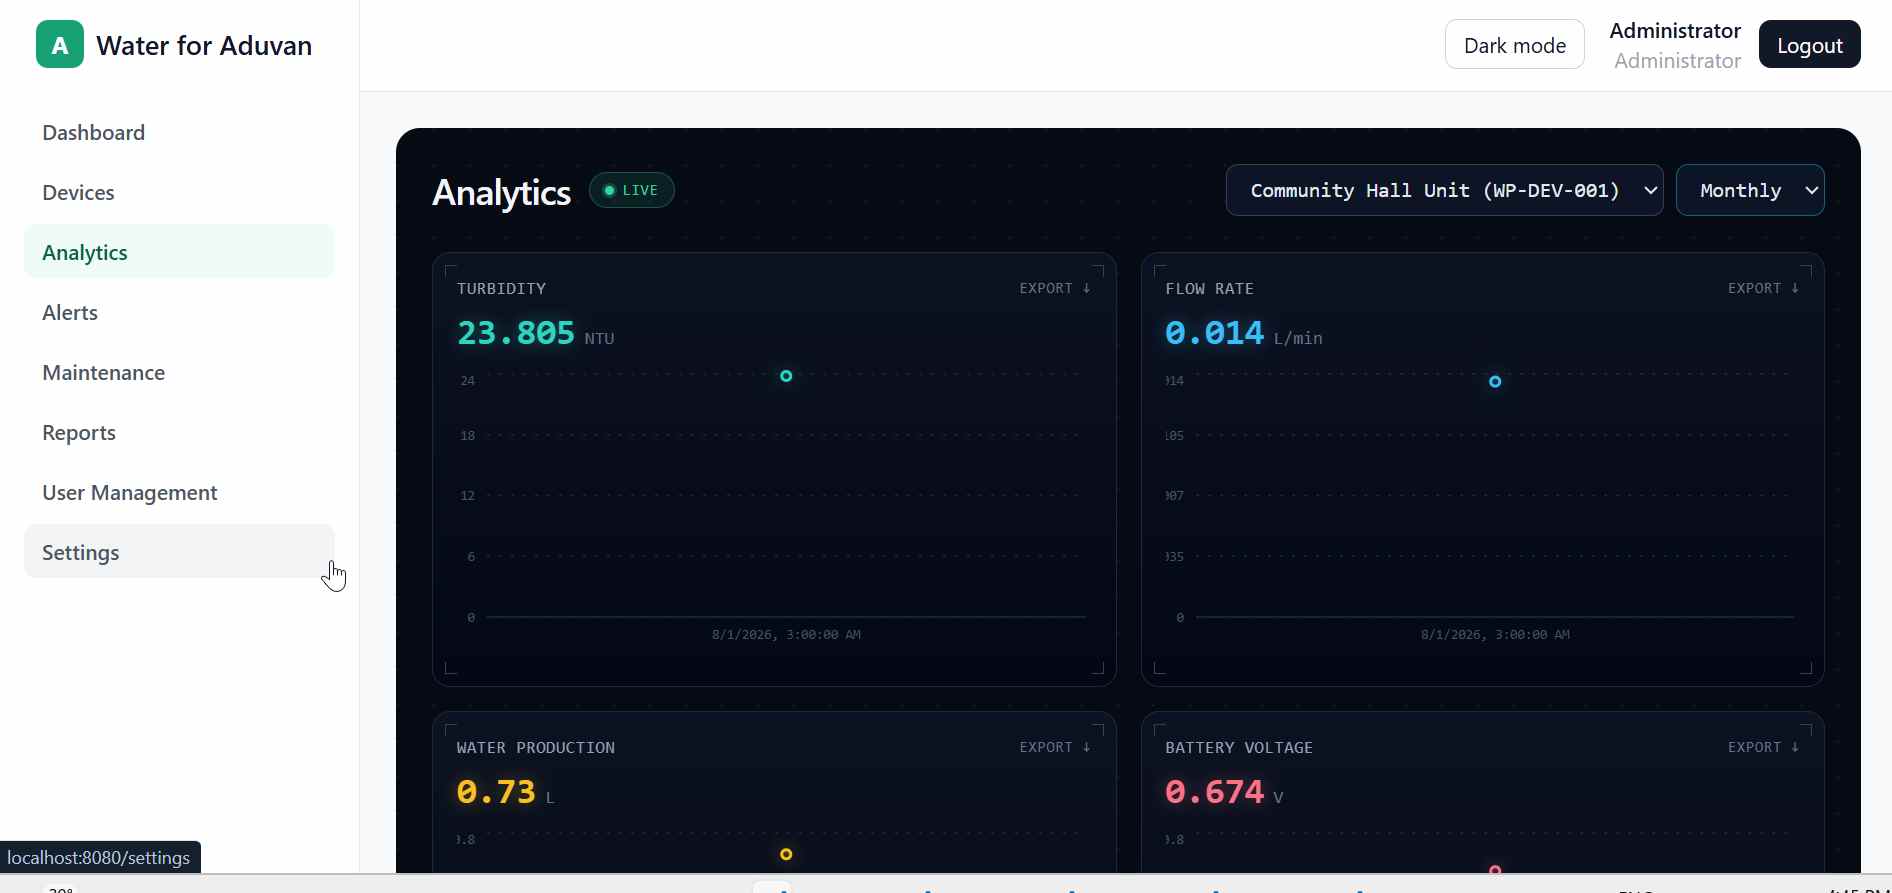
React was used to develop a responsive web dashboard for monitoring and controlling the water purification system. It displays live sensor data, historical analytics, device status, and administrative functions through reusable components.
PostgreSQL
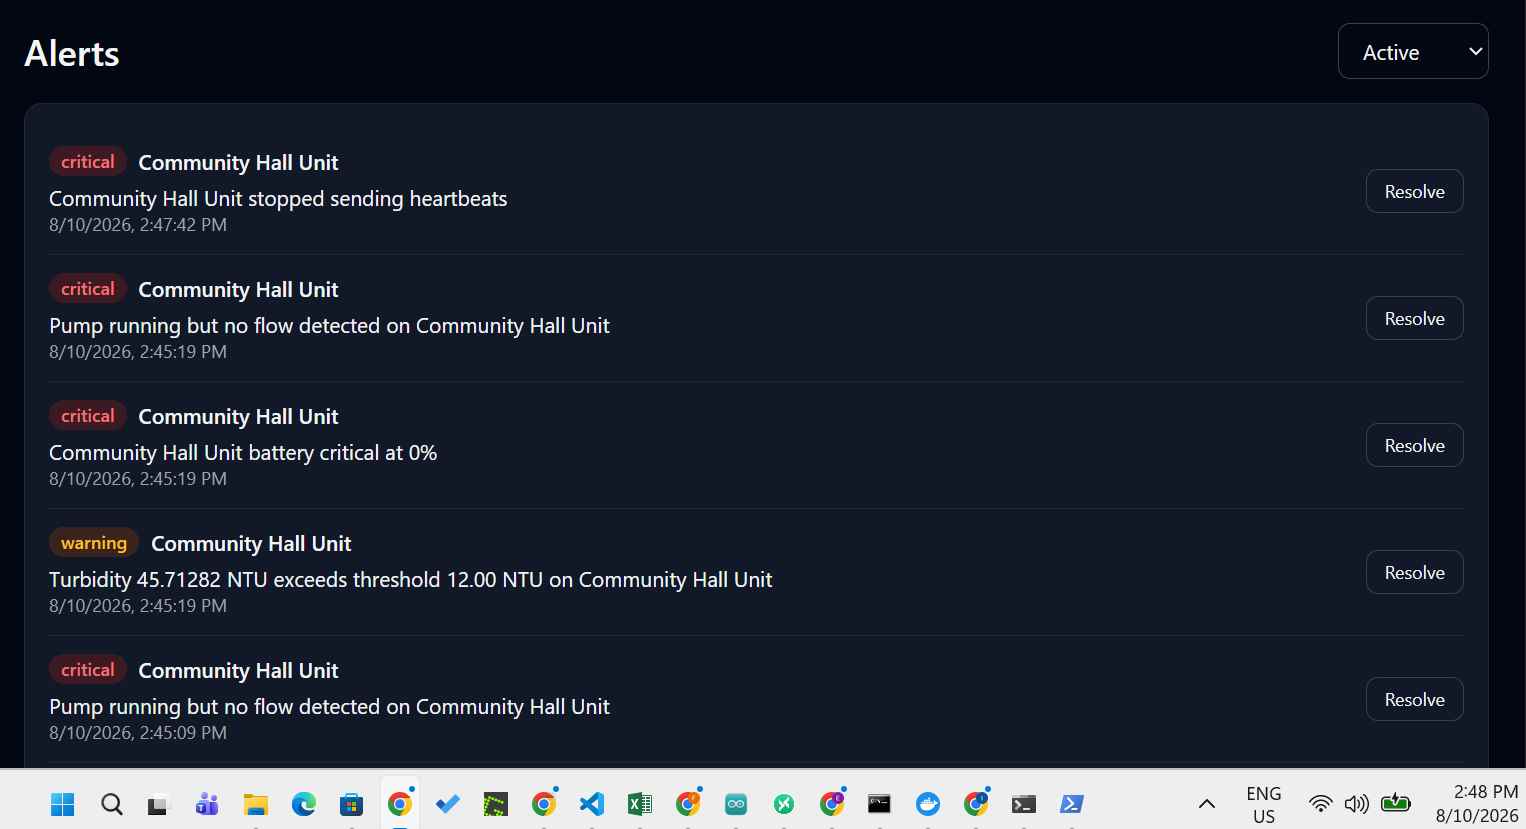
PostgreSQL was selected as the relational database for storing users, devices, sensor readings, water production records, alerts, maintenance history, and audit logs. It provides reliable and secure long-term data management.
WebSockets
WebSockets enable real-time communication between the backend and the dashboard. This allows live updates of sensor readings, device status, and alerts without requiring users to refresh the page.
Docker
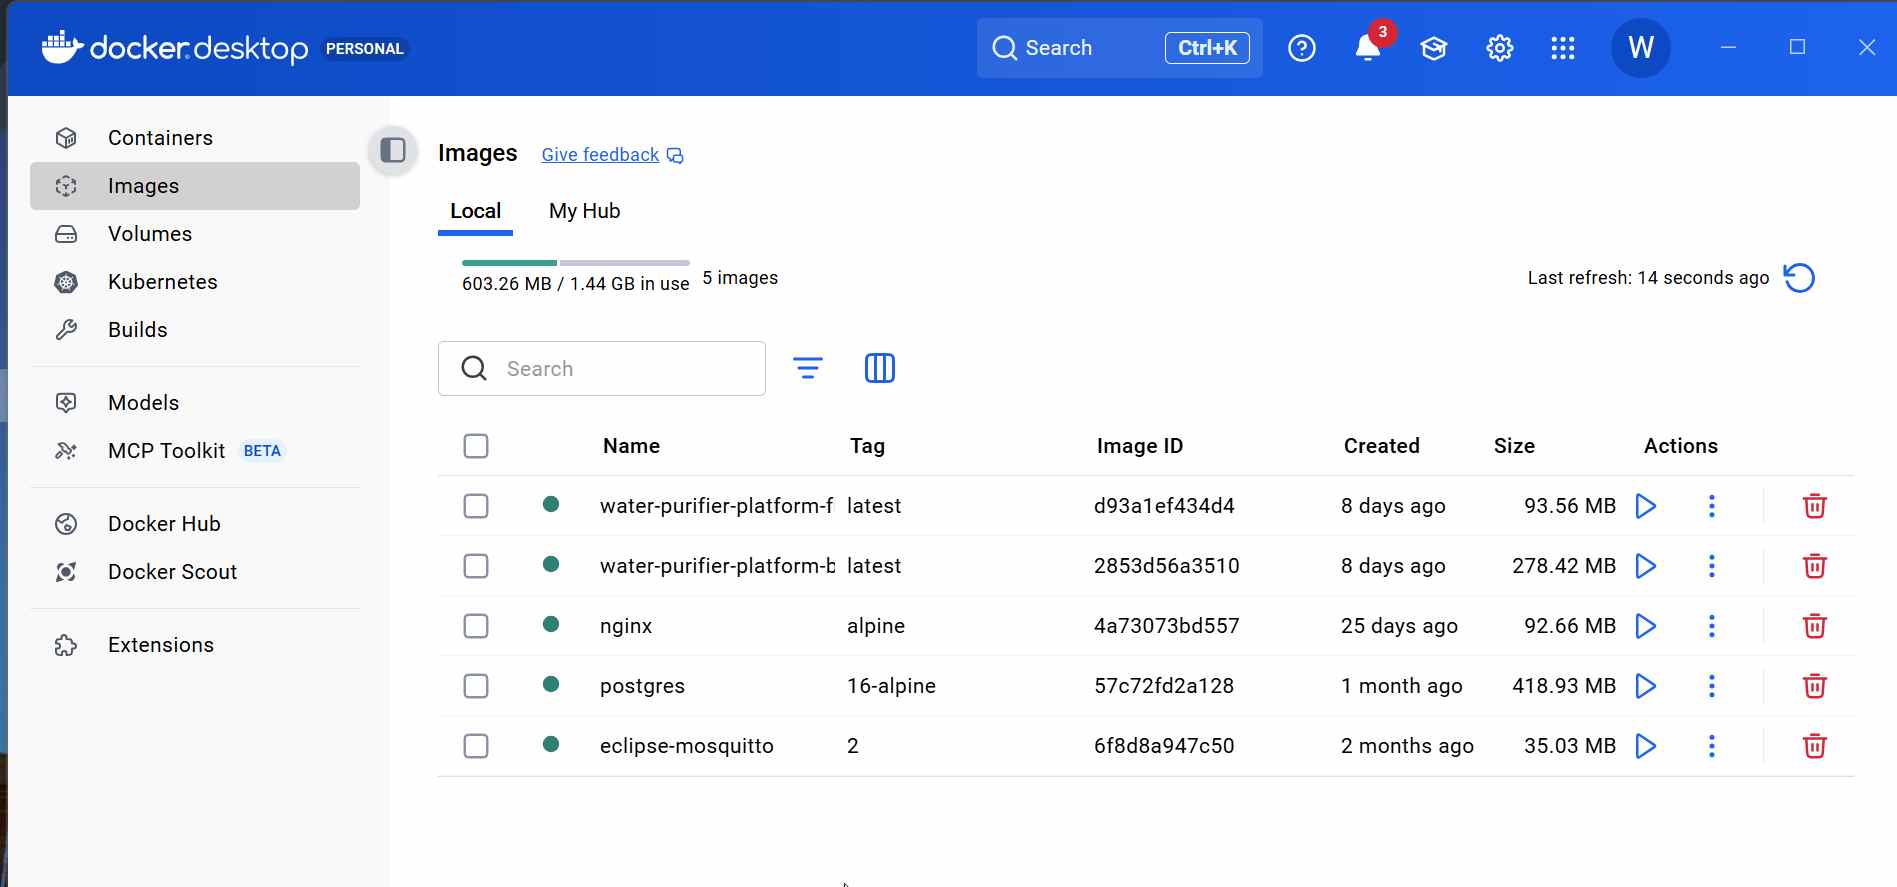
Docker was used to containerize the entire application, including the frontend, backend, database, MQTT broker, and reverse proxy. This ensures consistent deployment, simplifies maintenance, and improves scalability.
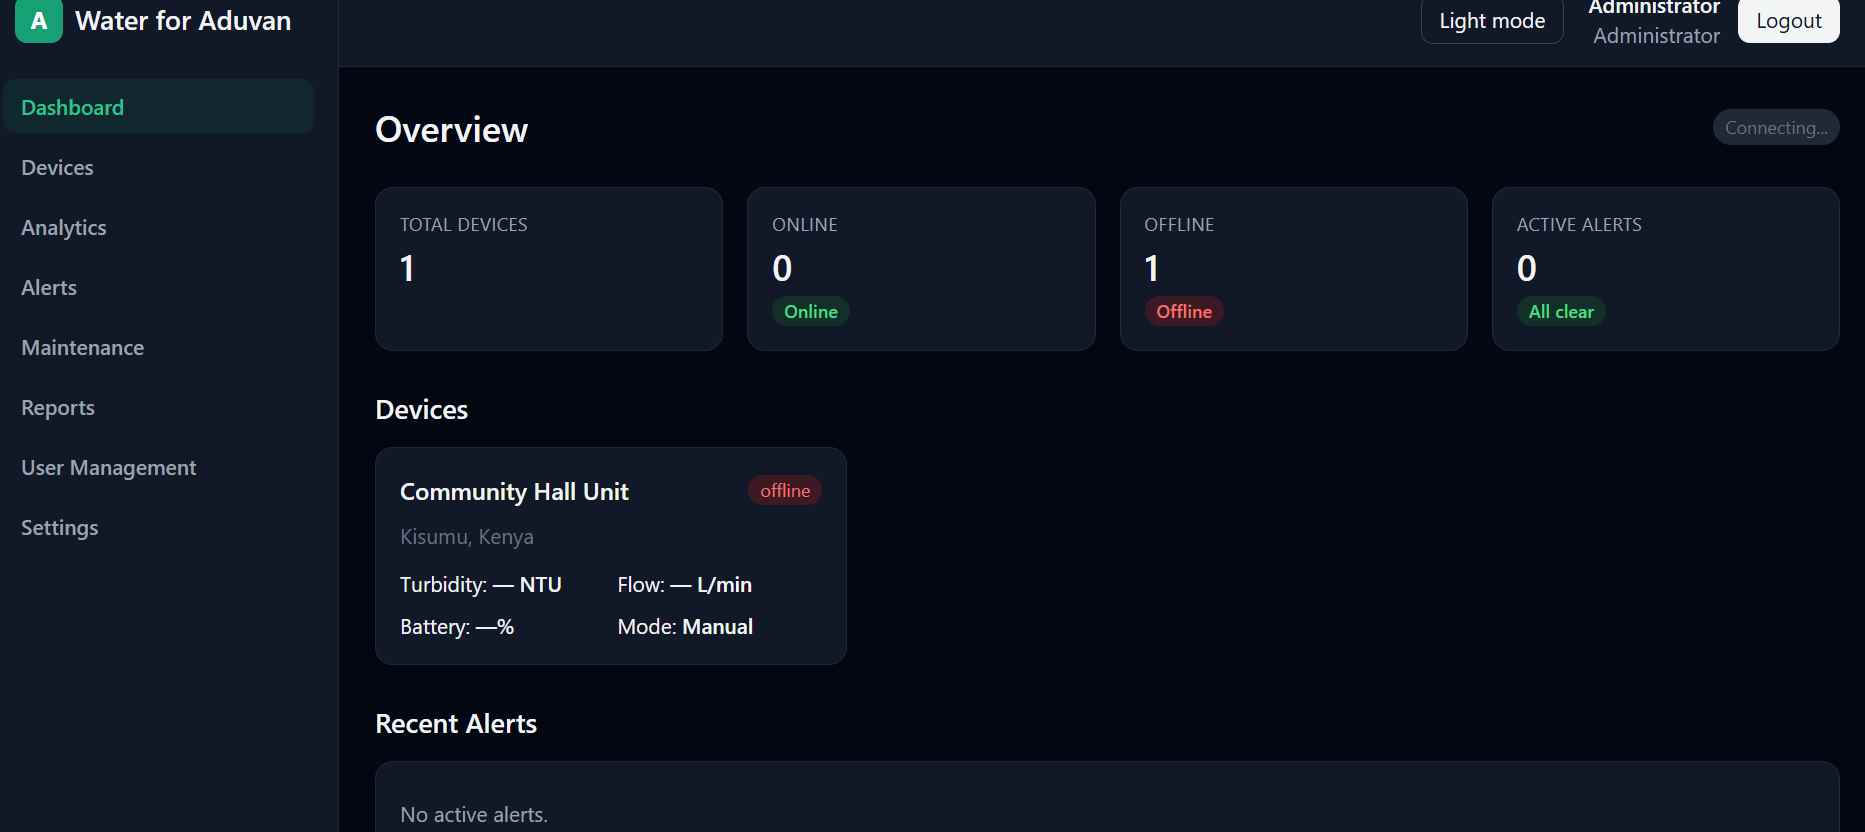
Dashboard
Run it
cp .env.example .env
docker compose up --build
Then open: http://localhost:8080
Ports
| Service | Port |
|---|---|
| Nginx (app) | 8080 |
| Backend API | 4000 (internal, proxied) |
| Postgres | 5432 |
| MQTT (TCP) | 1883 |
| MQTT (WS) | 9001 |
Folder layout
water-purifier-platform/
├── docker-compose.yml
├── .env.example
├── backend/          # Express API + MQTT ingestion + WebSocket
├── frontend/         # React dashboard (Vite)
├── mosquitto/        # Broker config + auth
├── nginx/            # Reverse proxy config
└── firmware/          # ESP32-C3 Arduino sketch
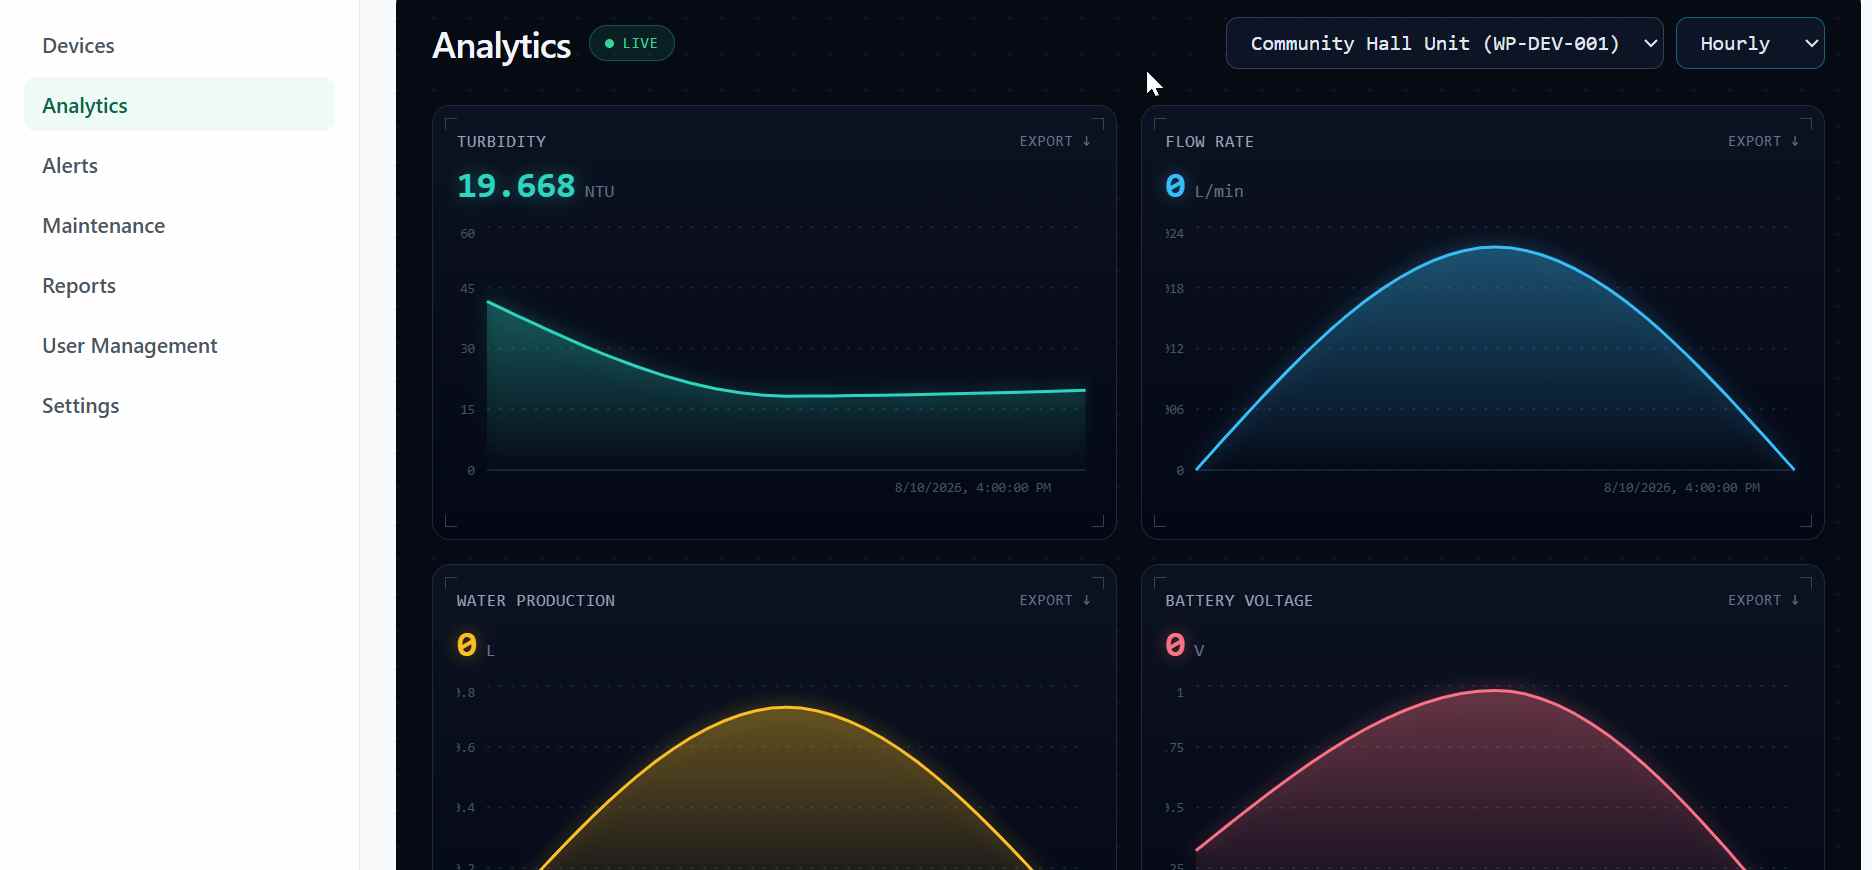
Analytics
Alerts
Devices
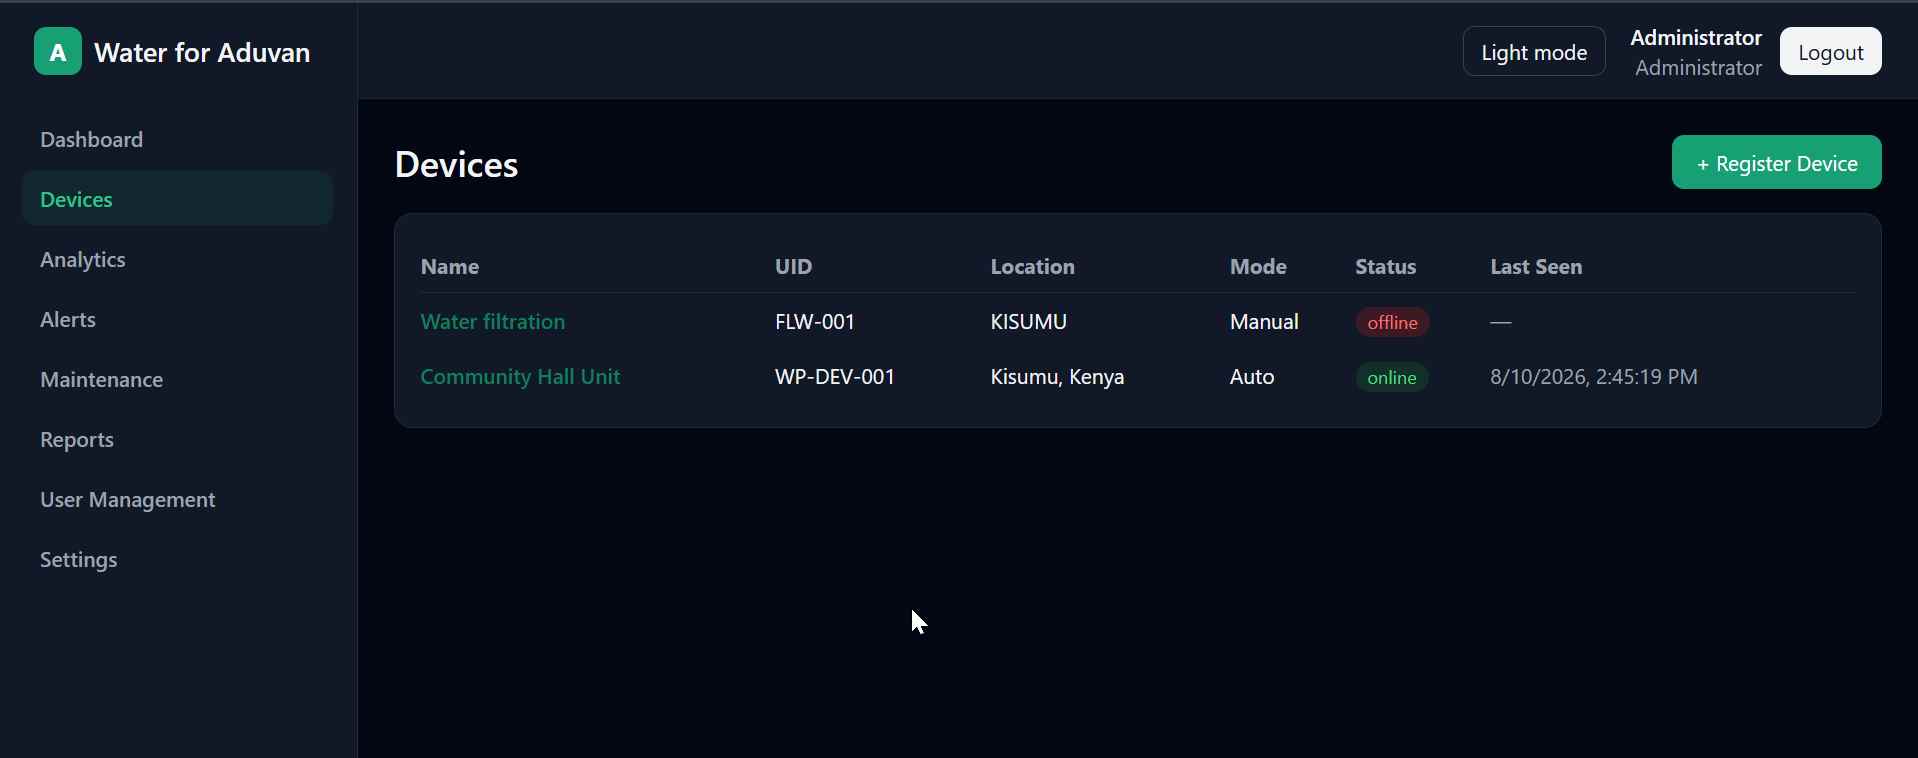
I am able to register my devices,and when conencts succefully they indicate online.
Flashing the firmware
Open firmware/xiao_esp32c3_water_purifier/xiao_esp32c3_water_purifier.ino
in Arduino IDE (install “Seeed XIAO ESP32C3” board package), edit the
WIFI_SSID, WIFI_PASSWORD, MQTT_HOST and DEVICE_ID constants at the top,
and upload. The device will publish telemetry to:
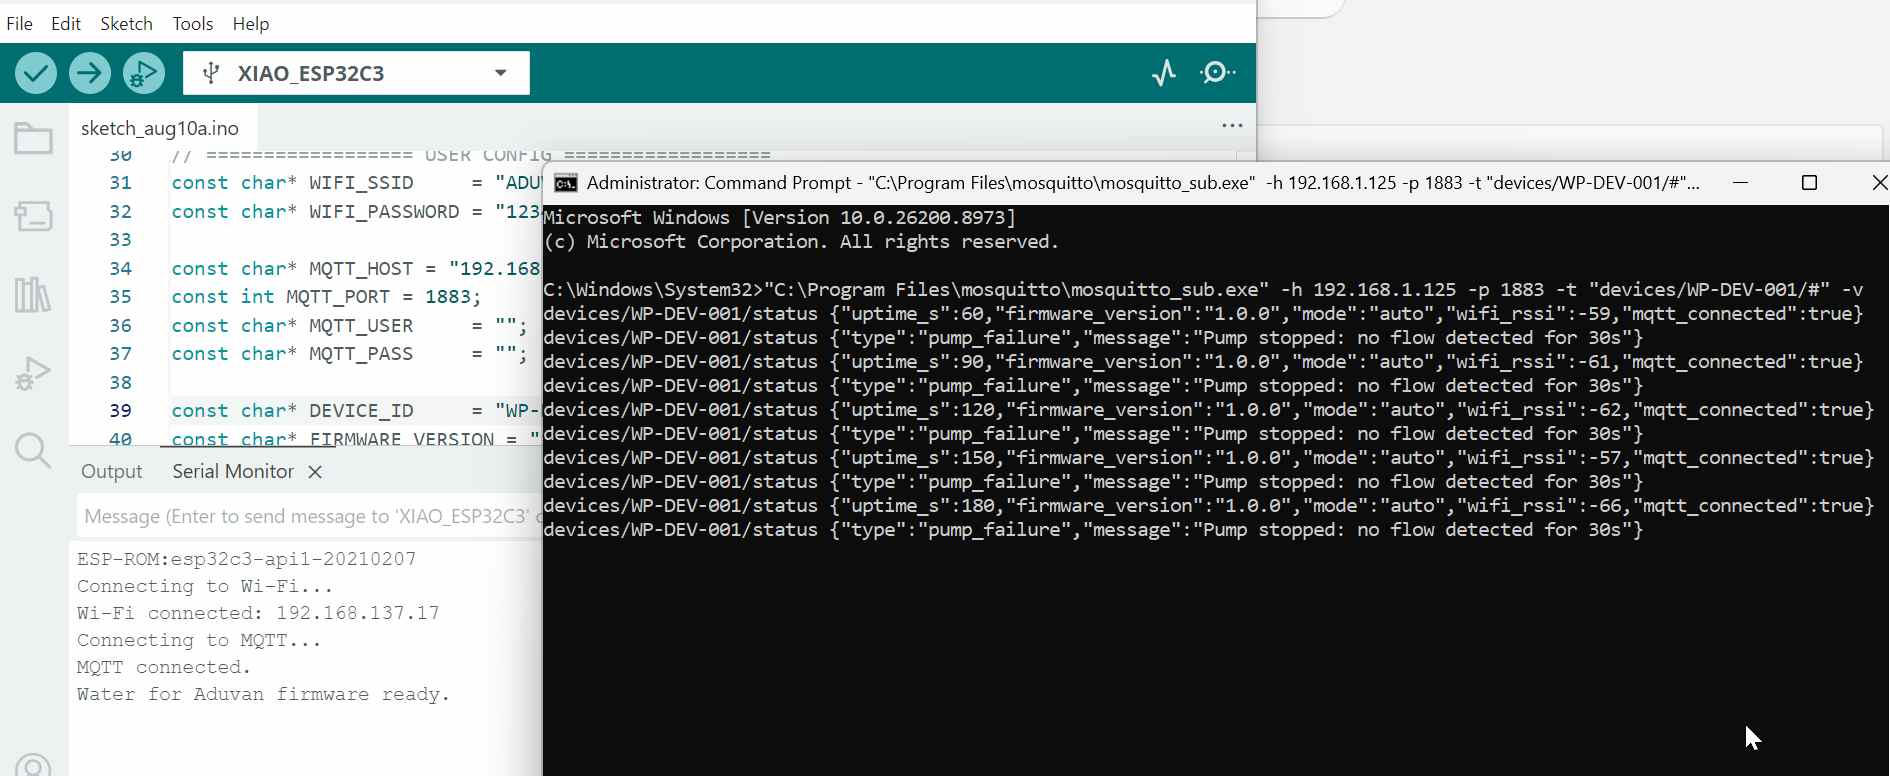
See backend/src/mqtt/mqttClient.js for the full topic contract.
Challenges — Troubleshooting Log
Project: Toyota Water Purifier Monitoring Platform (ESP32-C3 firmware + Node.js backend + React dashboard) Date: August 10, 2026 Symptom reported: Device connects to WiFi and MQTT successfully (confirmed via serial monitor), but the web dashboard showed all devices as offline / no data.
| # | Issue | Symptom | Diagnostic Steps & Commands Run | Root Cause | Fix Applied | Verification | Status |
|---|---|---|---|---|---|---|---|
| 1 | Duplicate MQTT brokers | ESP32 serial log says “MQTT connected,” dashboard shows nothing / all offline | 1. Checked DB directly: docker compose exec postgres psql -U wp_admin -d water_purifier -c "SELECT device_uid, status, last_seen_at FROM devices;" → devices existed but last_seen_at was NULL for both.2. Checked backend’s own broker connection: docker compose logs backend \| Select-String "mqtt" → showed [mqtt] connected to broker, so backend side was fine.3. Subscribed directly to the Docker broker to bypass the backend entirely: docker compose exec mosquitto mosquitto_sub -h localhost -t "devices/#" -v → only saw backend-issued commands messages, zero telemetry from the device.4. Ran ipconfig and compared the PC’s IP to the firmware’s hardcoded MQTT_HOST — they matched, ruling out an IP mismatch.5. Found a second, native Mosquitto broker running: "C:\Program Files\mosquitto\mosquitto.exe" -c "C:\Program Files\mosquitto\water-mqtt.conf" -v — this one did show the ESP32’s telemetry arriving, live.6. Checked the Windows service: Get-Service \| Where-Object {$_.Name -like "*mosquitto*"} → showed a Stopped service (not the culprit — the culprit was the manually launched instance in another terminal).7. Checked what was actually bound to port 1883: netstat -ano \| findstr :1883 → found two PIDs; identified them with Get-Process -Id <pid> — one resolved to com.docker.backend, confirming Docker held the port once the native instance was closed. |
A native Windows Mosquitto broker and the Docker mosquitto container were both capable of binding port 1883. The ESP32 was connecting successfully — just to the wrong broker, one the backend wasn’t subscribed to. |
Closed the manually-launched native broker terminal (Ctrl+C); disabled the Windows service permanently with sc config mosquitto start= disabled (PowerShell’s Set-Service isn’t available in cmd.exe, so sc was used instead) so it can’t restart on reboot. |
Re-ran docker compose exec mosquitto mosquitto_sub -h localhost -t "devices/#" -v → telemetry and status messages from WP-DEV-001 began appearing every ~10 seconds. Dashboard flipped the device to “online.” |
✅ Fixed |
| 2 | MQTT packet size limit | Even with only one broker running, telemetry initially still failed to arrive (found while investigating Issue 1, fixed alongside it) | Reviewed the firmware’s publishTelemetry() function and noticed the return value of mqtt.publish() was never checked; calculated the approximate payload size (12 JSON fields + topic string) against PubSubClient’s known 256-byte default packet limit. |
PubSubClient’s default MQTT_MAX_PACKET_SIZE is 256 bytes, covering the entire packet (topic + payload + protocol overhead) — the telemetry JSON payload exceeded this, and publish() was failing silently (returns false, sends nothing, no error surfaced). |
In xiao_esp32c3_water_purifier.ino, added mqtt.setBufferSize(512); immediately after mqtt.setServer(MQTT_HOST, MQTT_PORT); in setup(). Also updated publishTelemetry() to log failures instead of ignoring them: bool ok = mqtt.publish(...); if (!ok) Serial.println("Telemetry publish FAILED (packet too large?)"); |
Re-uploaded firmware via Arduino IDE; serial monitor showed no publish-failure warnings; broker logs showed telemetry payloads of 234–235 bytes arriving successfully every 10 seconds. | ✅ Fixed |
| 3 | Command ID type mismatch | Remote commands (restart, pump on/off, valve, threshold) executed on the device but the dashboard never reflected acknowledgment | Read through onMqttMessage() and ackCommand() in the .ino file side-by-side with the backend’s sendCommand() in mqttClient.js, which publishes { command_id: record.id, ... } where record.id is a Postgres gen_random_uuid() — a string, not a number. |
Firmware parsed the command payload with long commandId = doc["command_id"] \| 0; — ArduinoJson can’t parse a UUID string as a long, so it always resolved to 0. ackCommand(long commandId, ...) then hit if (commandId == 0) return; on every single call, silently discarding every acknowledgment. |
Changed the type from long to String in two places: the parse line (String commandId = doc["command_id"] \| "";) and the function signature (void ackCommand(const String& commandId, bool success) { if (commandId.length() == 0) return; ... }). |
Re-uploaded firmware; issued a restart command from the dashboard; confirmed device rebooted (new “Water for Aduvan firmware ready.” line in serial monitor) and the command’s status updated in the UI instead of staying stuck pending. | ✅ Fixed |
| 4 | Silent frontend error handling | Analytics page showed no chart data with no error message; clicking Remote Control buttons (Restart, Pump, Valve) appeared to do nothing | Reviewed Dashboard.jsx’s refresh(), Analytics.jsx’s per-metric fetch loop, and DeviceDetails.jsx’s action() wrapper — all three called their respective API functions with no surrounding try/catch. |
Any failed request (expired token, 500 error, edge-case query) would throw inside an async function with no error handler, leaving the relevant piece of UI state simply un-set. The result looked identical to “no data” or “nothing happened,” with zero visible indication that a request had actually failed. |
Wrapped each async data-fetch/action in try/catch, storing err.response?.data?.error \|\| err.message in a new error/actionError state variable, and rendered that message as a visible red banner in each page (Dashboard.jsx, Analytics.jsx, DeviceDetails.jsx’s Remote Control panel). |
Rebuilt and redeployed the frontend: docker compose build frontend --no-cache then docker compose up -d frontend nginx. Any future failed request now prints its actual error message directly in the UI instead of failing silently. |
✅ Fixed |
Verification commands used throughout
docker compose exec postgres psql -U wp_admin -d water_purifier -c "SELECT device_uid, status, last_seen_at FROM devices;"— confirm devices are seeded and check last-seen timestampsdocker compose logs backend | Select-String "mqtt"— confirm backend connected to the broker without reconnect loopsdocker compose exec mosquitto mosquitto_sub -h localhost -t "devices/#" -v— the single most useful command in this whole process; confirms, independent of the backend, whether the device’s messages are reaching the correct brokernetstat -ano | findstr :1883+Get-Process -Id <pid>— identify exactly which process holds the MQTT port when something unexpected is listening
Lessons for next time
- When something “connects” but no data shows up, verify at the transport layer first — subscribe directly to the broker with
mosquitto_subor MQTTX before assuming the bug is in the application code. - Check for port conflicts on shared ports (1883, 5432, etc.) when running Docker and native installs of the same tooling side by side.
- Never ignore a library’s default buffer/packet limits when payloads grow — PubSubClient’s 256-byte default is easy to outgrow silently.
- Match types across the stack — a UUID and a numeric ID look interchangeable in casual code review but are not.
- Silent failure is worse than a visible error. Every frontend data-fetch or action should surface failures to the user.