This week's assignment is to add a sensor to a designed micro-controller board and read it (individual); to probe an input device's analog levels and digital signals (in-group).
* All C++ and KiCad files can be downloaded here.
* This week's group assignment is to probe an input device's analog levels and digital signals.
* My plan for this week's progress was to make DIY sensors using basic components and test them in order to understand how sensors work and to design a board with built-in sensors. The board will be fabricated after the lockdown.
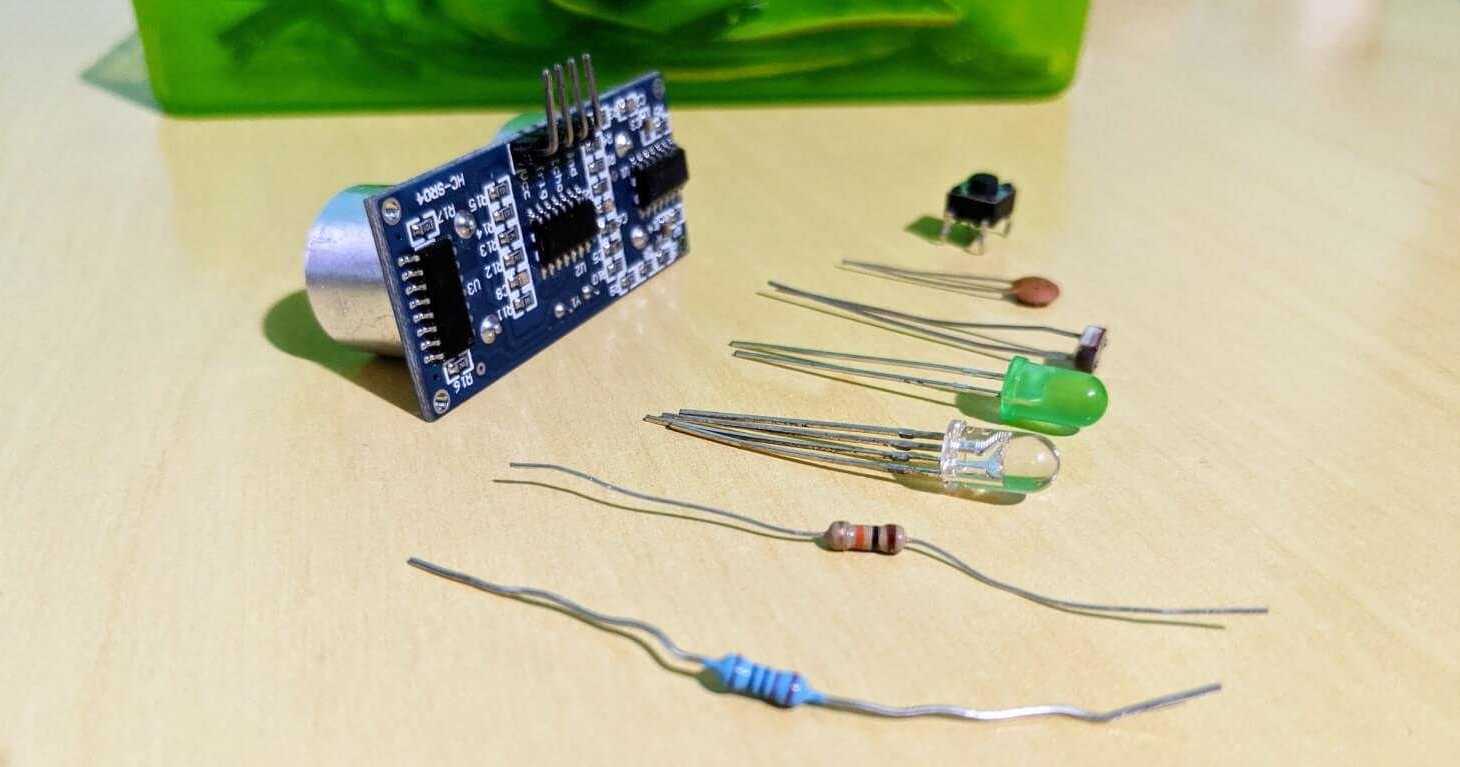
In an effort to maintain the classes during the COVID-19 pandemic, we were provided by our instructors a basic kit including an Arduino Uno board, an HC-SR04 ultrasonic 2 - 400cm distance sensor, a light-dependent resistor (LDR), some LEDs, some capacitors and some resistors.
I want to design a multi-sensor shield for an ESP32 board as my individual assignment as per the requirements of this week. Both the ESP32 board and the multi-sensor shield could be used for my Final Project and would be fabricated after the lockdown. Before being able to add sensors to a designed board, my plan for the lockdown period was to test the HC-SR04 ultrasonic proximity sensor and make a darkness/proximity sensor using the LDR and the LEDs. I want to work on those sensors for my Final Project so reading their data could be a good exercise.
Reading input signals
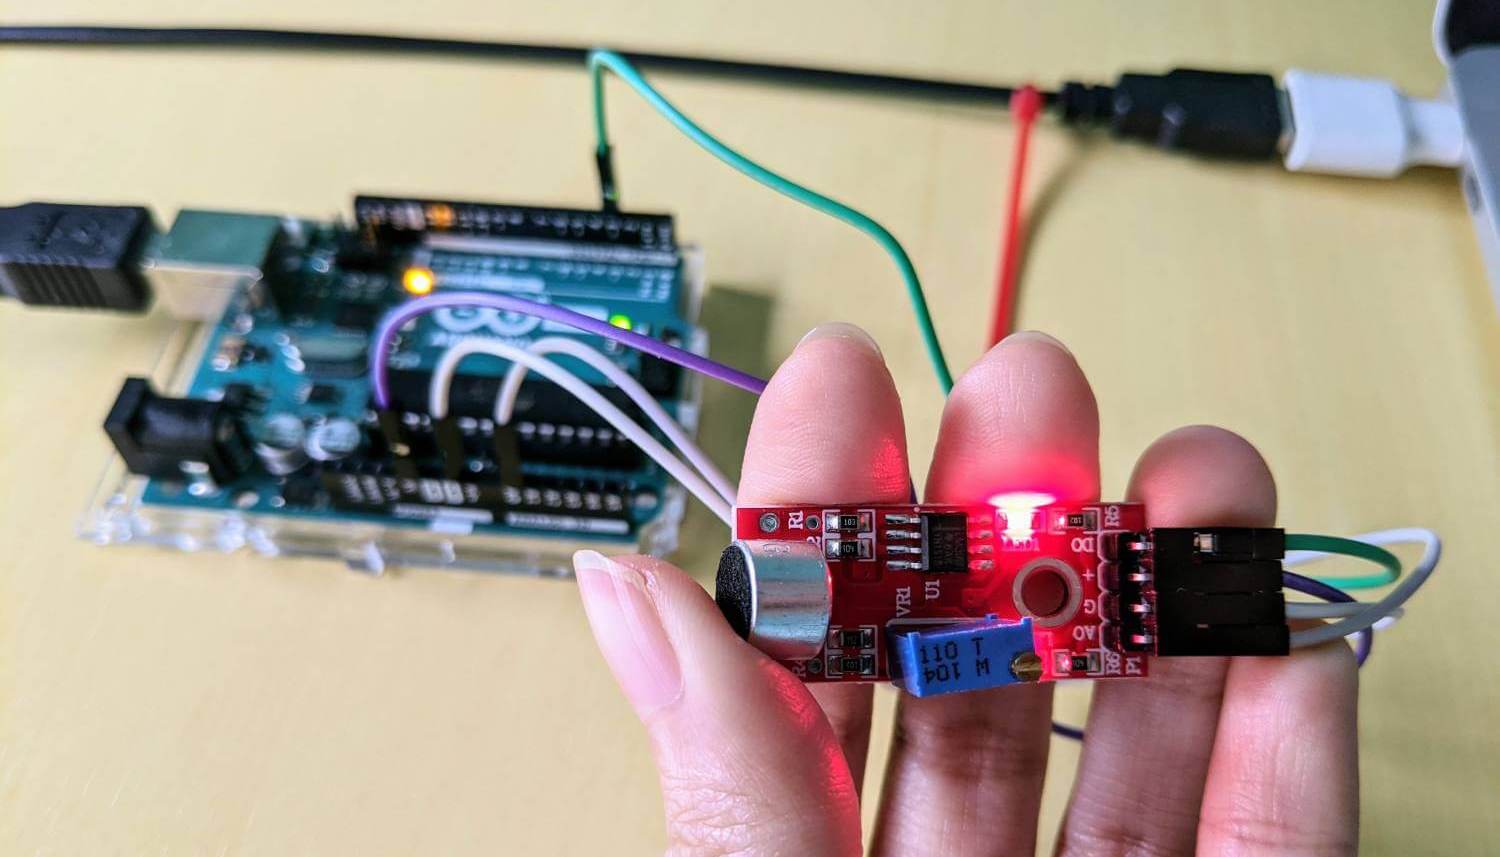
Group assignment - Probe the KY-037 sound sensor
As defined in the Assessment Guide, we have to measure, observe or monitor signals with test probes of a physical device. I only had a cheap multimeter with me and I tried to fulfill the requirements by probing the KY-037 sound sensor because it can produce both analog and digital outputs. Analog sensors continuously produce analog voltage signals as outputs and detect any proportional value between 100% (1.8V, 3.3V, 5V) and 0% (0V). A digital sensor only detect two possible status: if it is working at 100% (above a certain threshold value) or at 0% (below the threshold value). The signal measured is directly converted into digital signal output (0 and 1) inside the digital sensor itself. A detailed comparison can be found here.
The hardware connection was quite simple: I used jumper wires to connect the VCC pin of the sensor to the 5V pin of the Arduino Uno board, the GND pin to the GND pin, the A0 pin to the analog pin A0 and the D0 pin to the digital pin marked with number 3.
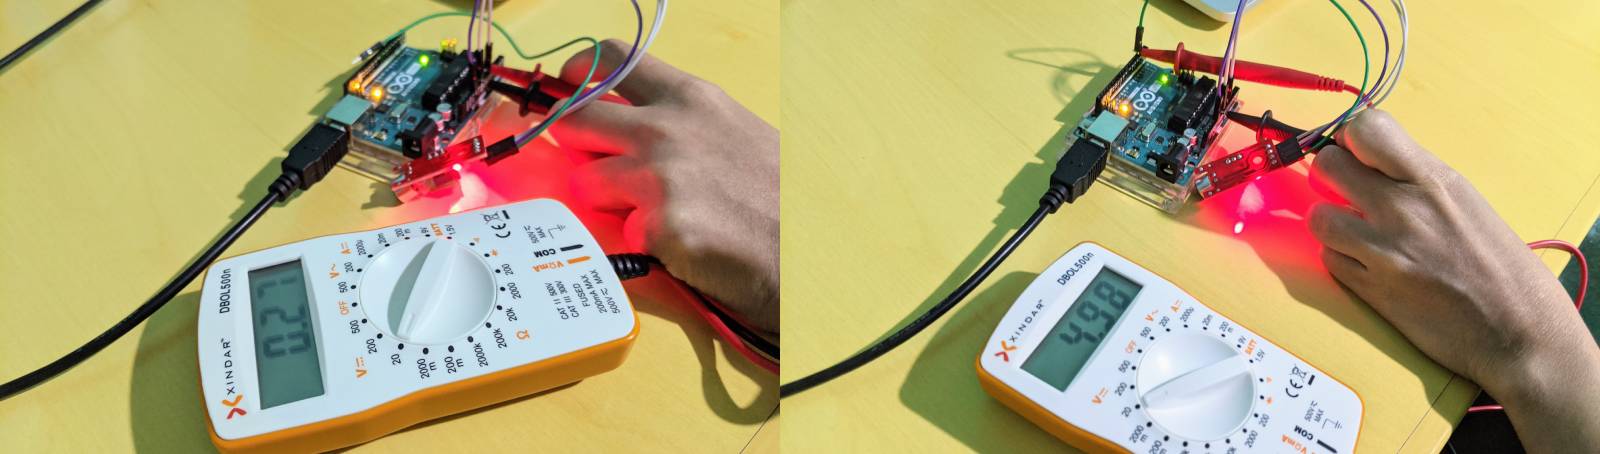
It's time to turn some music on! I could probe voltage values ranging from 0.22 - 0.28V by poking at GND and A0. Voltage values of 4.8 - 4.98V were measured while poking at GND and digital pin 3. They seemed plausible to me.
In order to see printed values of the digital and analog signals, I used Arduino IDE and its Serial Monitor. I printed the analog values (0 - 1023), the converted voltage from the analog values (0 - 5V), and the digital values (0 or 1):
    void setup() {
        pinMode (A0, INPUT);
        pinMode (3, INPUT);
        Serial.begin(115200);
    }

    void loop() {
        Serial.print(analogRead(A0));
        Serial.print(" ");
        Serial.print(analogRead(A0) * (5.0 / 1023.0));
        Serial.print(" ");
        Serial.println(digitalRead(3));
        delay(1000);
    }
As per the data sheet, the signal will be inverted, which means the louder the noise detected, the lower the value at the analog output. The sensor was super sensitive. I had to turn off the music, pressed the microphone to my pillow in order to get a higher analog value (over 500), and I could not manage to get a digital value of 0, even if I tried to keep it completely silent and reduced sensivity by rotating the potentiometer.
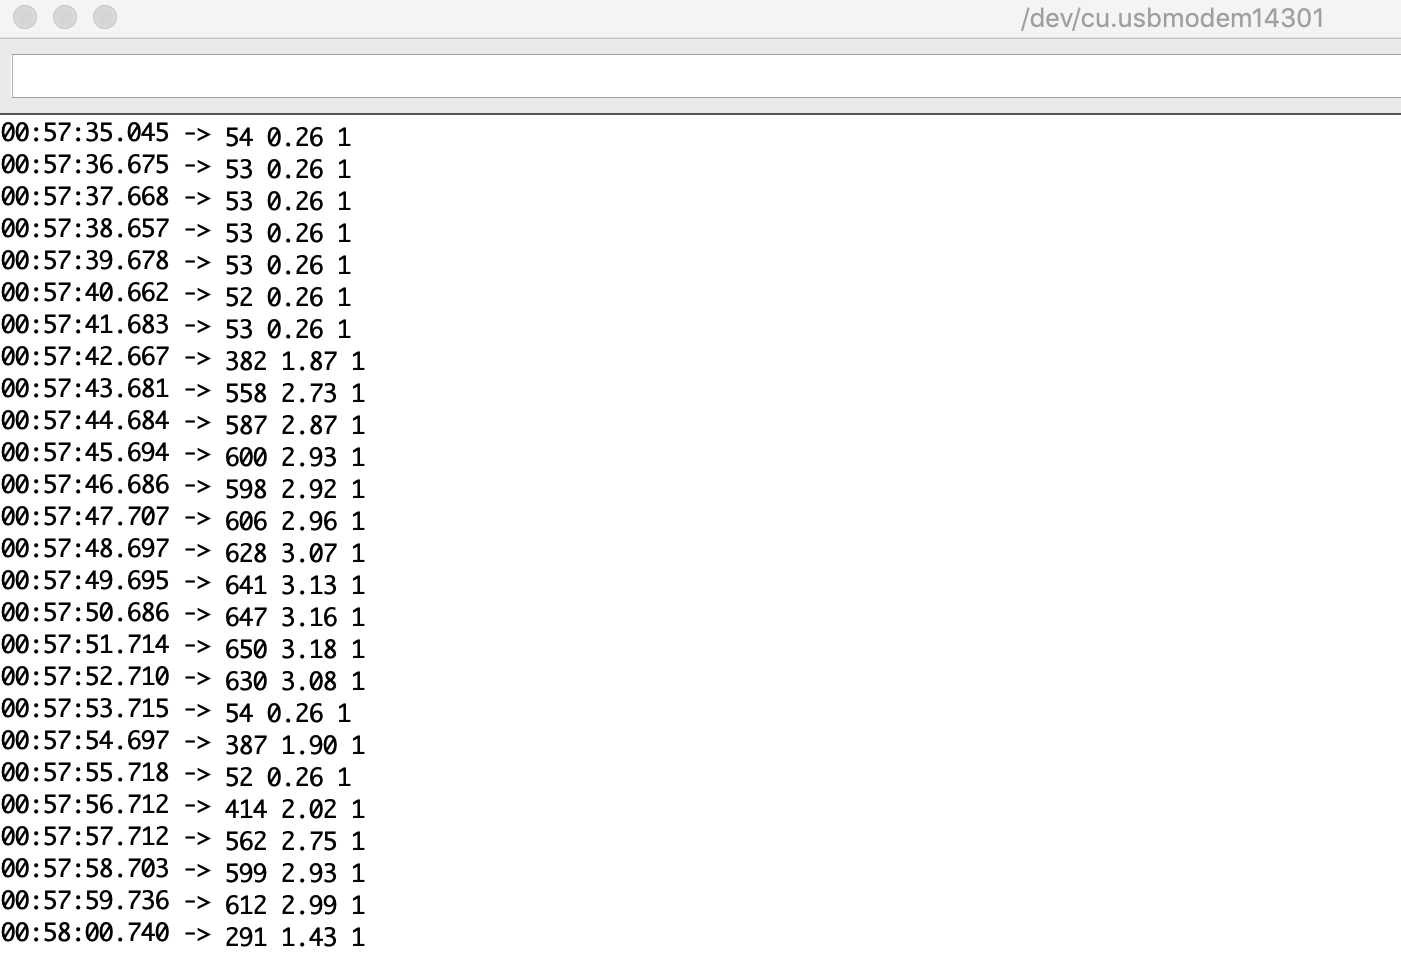
Here I can detected similar analog voltage values as when I probed with the multimeter (~0.26V). I will try to do this group assignment properly by using an oscilloscope when we get back to the lab.
Additional test - Read the HC-SR04 ultrasonic proximity sensor
I need a distance sensor for my Final Project, so I scrolled through this article and this instruction. The main reason why I chose to go ahead with the ultrasonic proximity sensor is that I want to play with a medium range of distance (8 - 30cm), I need something small and cheap (less than 10€) that consumes less current, and the sensor must be able to work well under low light conditions. Most of the other options are either expensive, have too narrow or too wide range, have large footprints, or demand high continuous current.
Ultrasonic proximity sensors work by emitting sound waves that travel through the air with the speed of sound, roughly 0.034 cm/s. If there is an object in front of the sensor, the sound waves get reflected back and the receiver of the ultrasonic sensor detects them. By measuring how much time passed between sending and receiving the sound waves, the distance between the sensor and the object can be calculated. The formula I used was distance = (travel time * speed of sound)/2.
In order to know the required voltage of the HR-SC04 sensor I had with me, I referred to this data sheet. I wanted to use the Barduino ESP32 board, but the sensor requires a working voltage of 5V which exceeds the working voltage of the Barduino board. Hence, I used the provided Arduino Uno board instead and followed this tutorial in order to understand how to use Arduino to read the data from the ultrasonic sensor. I also tried connecting the sensor to my custom ATtiny1614 board which was designed in the 6th week and using Arduino Uno to program it (similar to what I did last week). Below are 2 programs I used for both boards:
    /*
     * Arduino framework must be explicitly included
     */
    #include <Arduino.h>
    /*
     * useful variables
     */
    // pin variables
    int trig = 11;
    int echo = 12;
    int led = 13;
    // variables to store values after reading data from the sensor
    long unsigned duration = 0;
    int distance = 0;
    // trying basic threshold DSP, when the distance is greater than 10cm, do something
    const int threshold = 10;
    /*
     * setup function, to run once
     */
    void setup() {
        pinMode(trig, OUTPUT);
        pinMode(echo, INPUT);
        pinMode(led, OUTPUT);
        // begin the serial communication with the baud rate of 115200
        Serial.begin(115200);
    }
    /*
     * loop function, to run repeatedly
     */
    void loop() {
        // the LED will always be turned on
        digitalWrite(led, HIGH);
        /*
         * trigger the sensor
         */
        // clear the trigger pin
        digitalWrite(trig, LOW);
        delayMicroseconds(5);
        // trigger the sensor by setting the trigger pin high for 10 microseconds
        digitalWrite(trig, HIGH);
        delayMicroseconds(20);
        digitalWrite(trig, LOW);
        /*
         * read and process data
         */
        // pulseIn() measures the time period of a pulse (either HIGH or LOW) input signal
        // if value is HIGH, pulseIn() waits for the pin to go HIGH, starts timing, then waits for the pin to go LOW and stops timing
        // pulseIn() returns the duration in microseconds
        duration = pulseIn(echo, HIGH);
        // and calculate the distance based on the formula: distance = (travel time * speed of sound)/2
        distance = (duration * 0.034)/2;
        /*
         * blink the LED when the distance is greater than 10cm
         */
        if (distance >= threshold) {
            digitalWrite(led, LOW);
        }
        /*
         * print the data on the serial monitor
         */
        // Serial.print("Duration: ");
        // Serial.println(duration);
        // Serial.print("Distance: ");
        // Serial.println(distance);
        /*
         * print the data on the serial plotter
         * values were modified for a nicer graph
         */
        Serial.print(threshold * 100);
        Serial.print(" ");
        Serial.print(digitalRead(led) * 100);
        Serial.print(" ");
        Serial.print(duration);
        Serial.print(" ");
        Serial.println(distance * 100);
        delay(1000);
    }
    /*
     * new pin variables
     */
    int trig = 4;
    int echo = 5;
    long unsigned duration = 0;
    int distance = 0;
    /*
     * set the LED pins to OUTPUT
     */
    void setup() {
        pinMode(trig, OUTPUT);
        pinMode(echo, INPUT);
        pinMode(0, OUTPUT);
        pinMode(1, OUTPUT);
        pinMode(2, OUTPUT);
        pinMode(3, OUTPUT);
        pinMode(8, OUTPUT);
        pinMode(9, OUTPUT);
        pinMode(10, OUTPUT);
        Serial.begin(112500);
    }
    void loop() {
        reset();
        digitalWrite(trig, LOW);
        delayMicroseconds(5);
        digitalWrite(trig, HIGH);
        delayMicroseconds(20);
        digitalWrite(trig, LOW);
        duration = pulseIn(echo, HIGH);
        distance= (duration * 0.034)/2;
        /*
         * call a function to display certain numbers according to the distance
         */
        displayNumber(distance);
        delay(200);
    }
    /*
     * conditions to display numbers
     */
    void displayNumber(int distance) {
        if (distance >= 5 && distance < 10) {
            digitalWrite(1, HIGH);
        }
        else if (distance >= 10 && distance < 15) {
            digitalWrite(2, HIGH);
            digitalWrite(10, HIGH);
        }
        else if (distance >= 15 && distance < 20) {
            digitalWrite(1, HIGH);
            digitalWrite(2, HIGH);
            digitalWrite(10, HIGH);
        }
        else {
            reset();
        }
        delay(1000);
    }
    void reset() {
        digitalWrite(0, LOW);
        digitalWrite(1, LOW);
        digitalWrite(2, LOW);
        digitalWrite(3, LOW);
        digitalWrite(8, LOW);
        digitalWrite(9, LOW);
        digitalWrite(10, LOW);
    }
Arduino Uno board
The hardware connection was quite simple: I used jumper wires to connect the VCC pin of the HC-SR04 sensor to the 5V pin of the Arduino Uno board, the GND pin to the GND pin, the Echo pin to the digital pin PB4 (marked with number 12) and the Trig pin to the digital pin PB3 (marked with number 11).
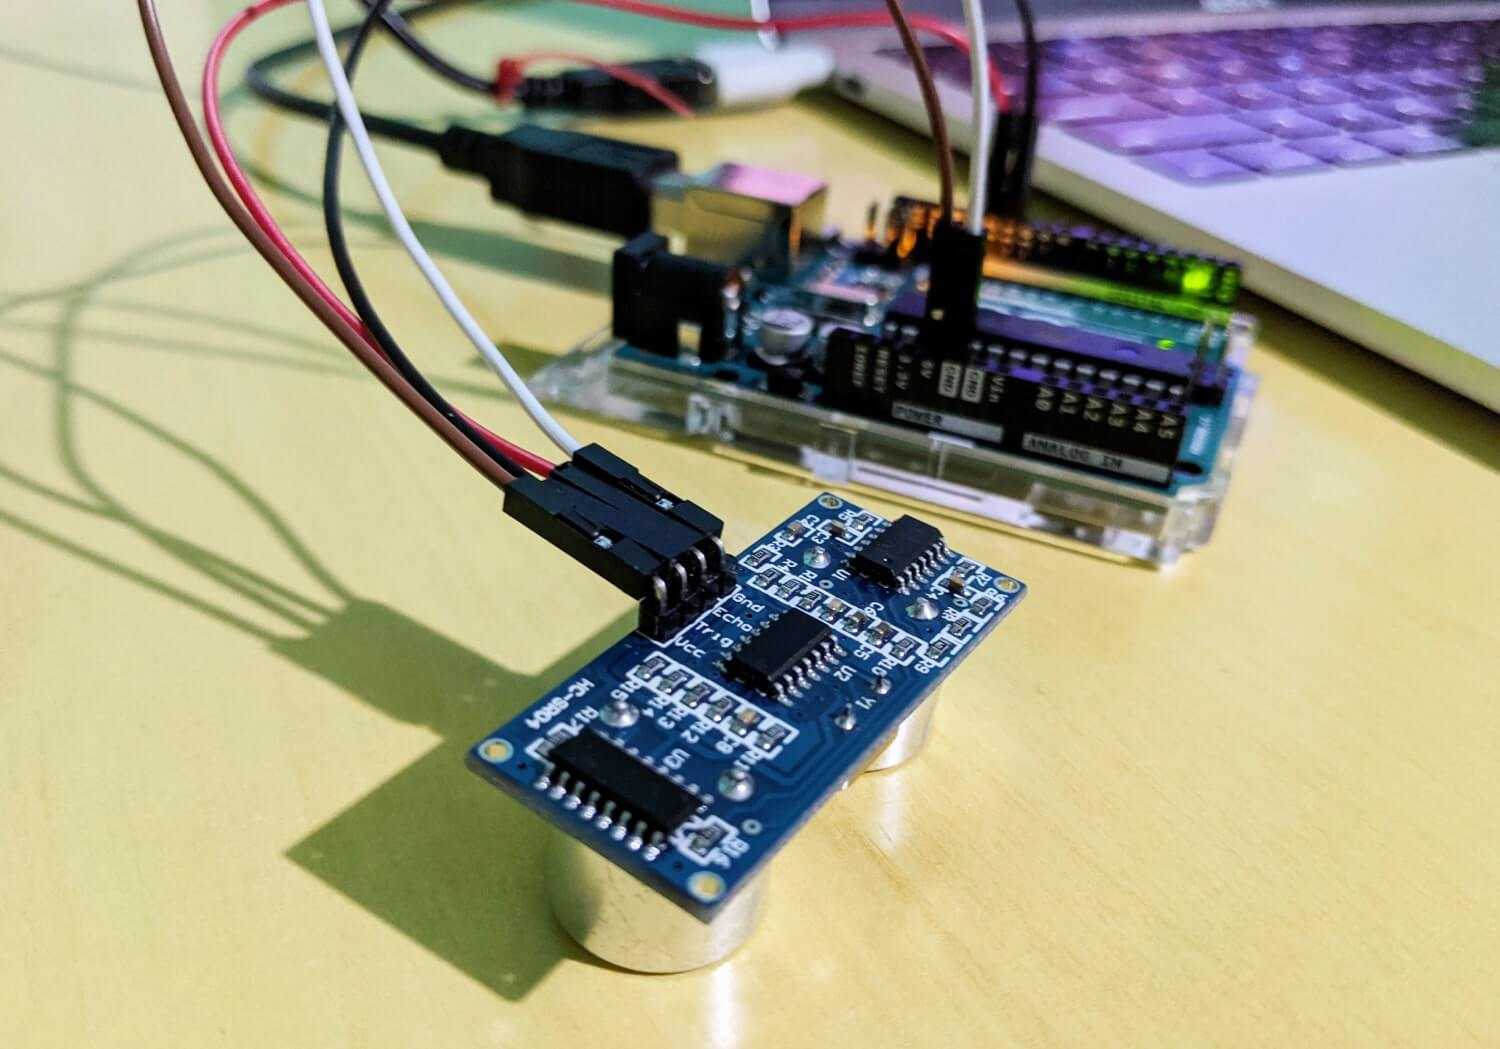
PlatformIO was used for the whole process since I had a good experience using it during the previous assignment. This time, I tried using Arduino framework:
- $ pio project init --board uno: initialize the project
- Create a new
main.cppfile into thesrcfolder and input the source code - $ pio run -t upload: compile and upload the program
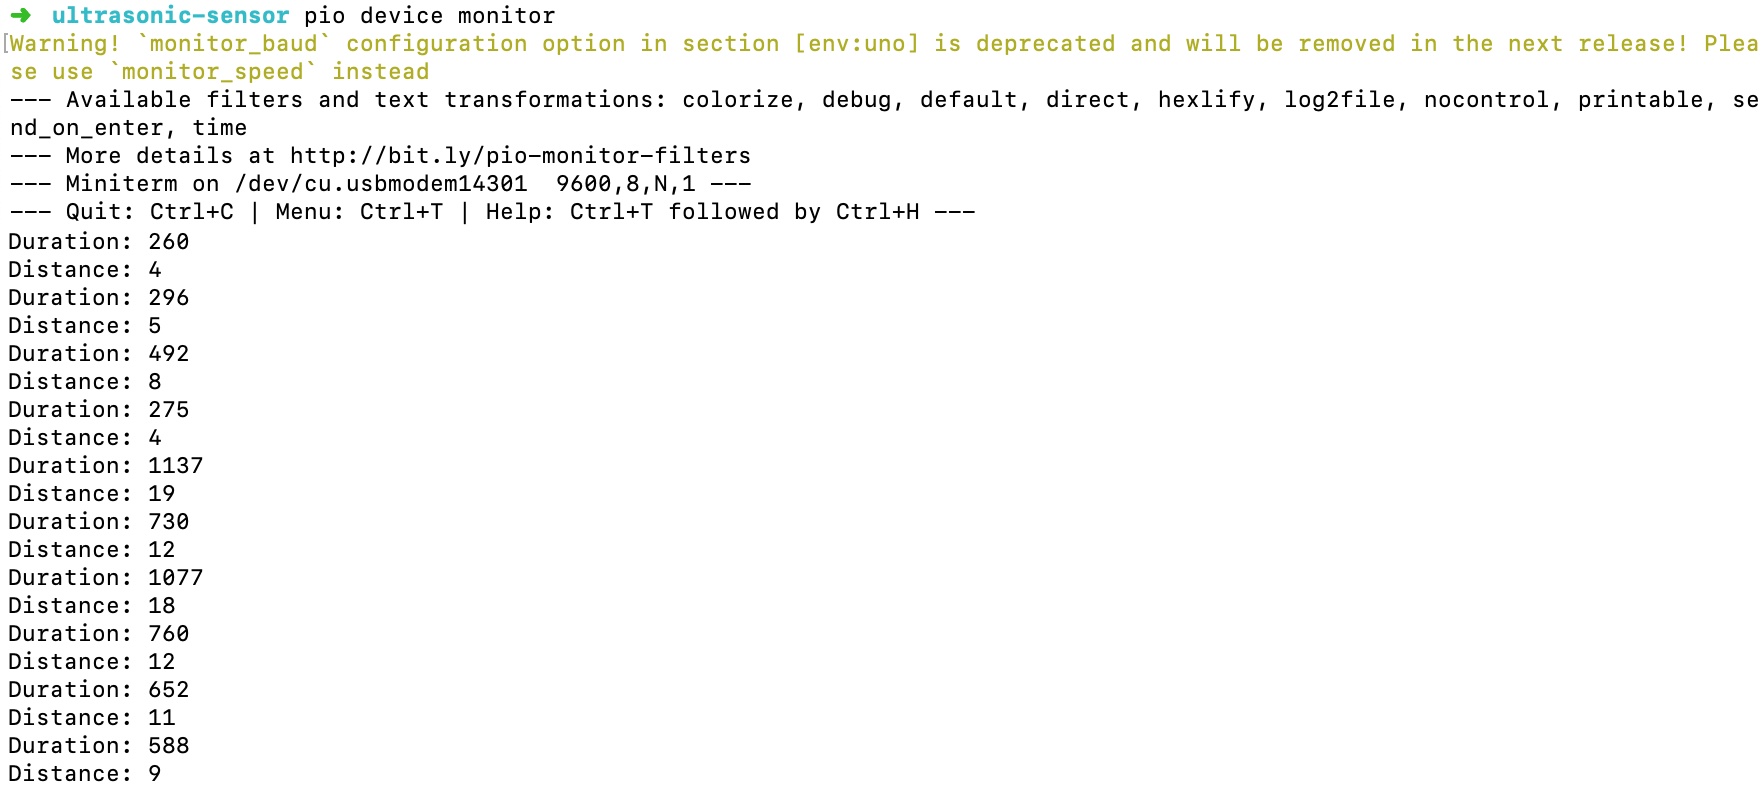
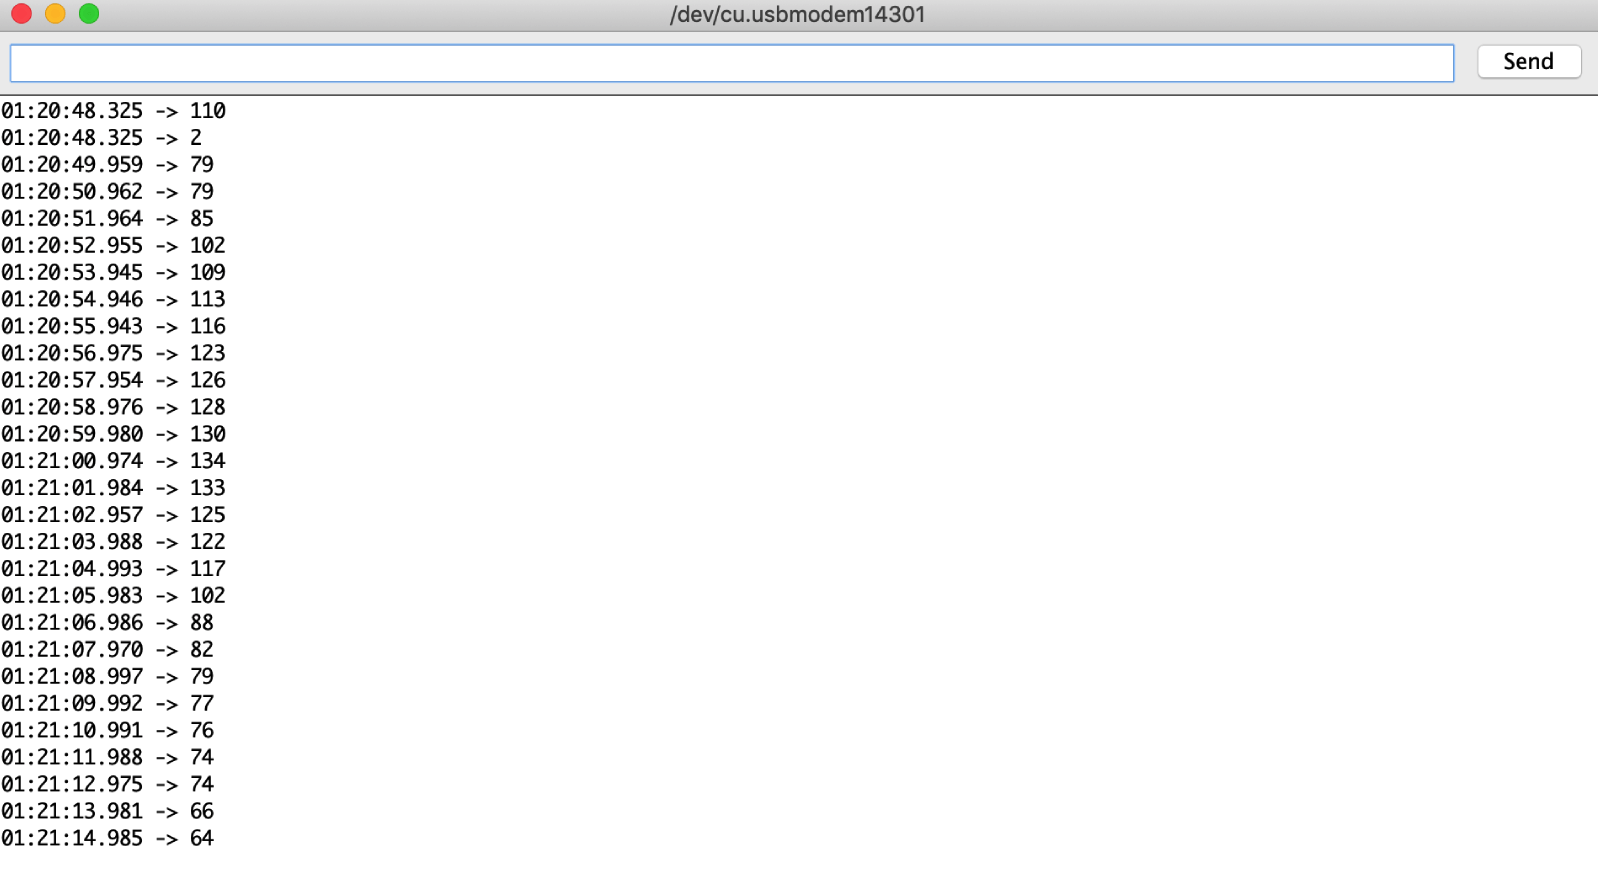
To see the duration and distance printed in the built-in serial monitor of PlatformIO, I ran $ pio device monitor. The results were more or less accurate, but sometimes when I directly touched the receiver of the sensor, or when my hand was too far away, it returned weird values, such as 2240 something. It could be because the sensor can only recognize distance within the range of 2 - 400cm, however, as per my observations, the values seemed to be more accurate within the range of 2 - 60cm.
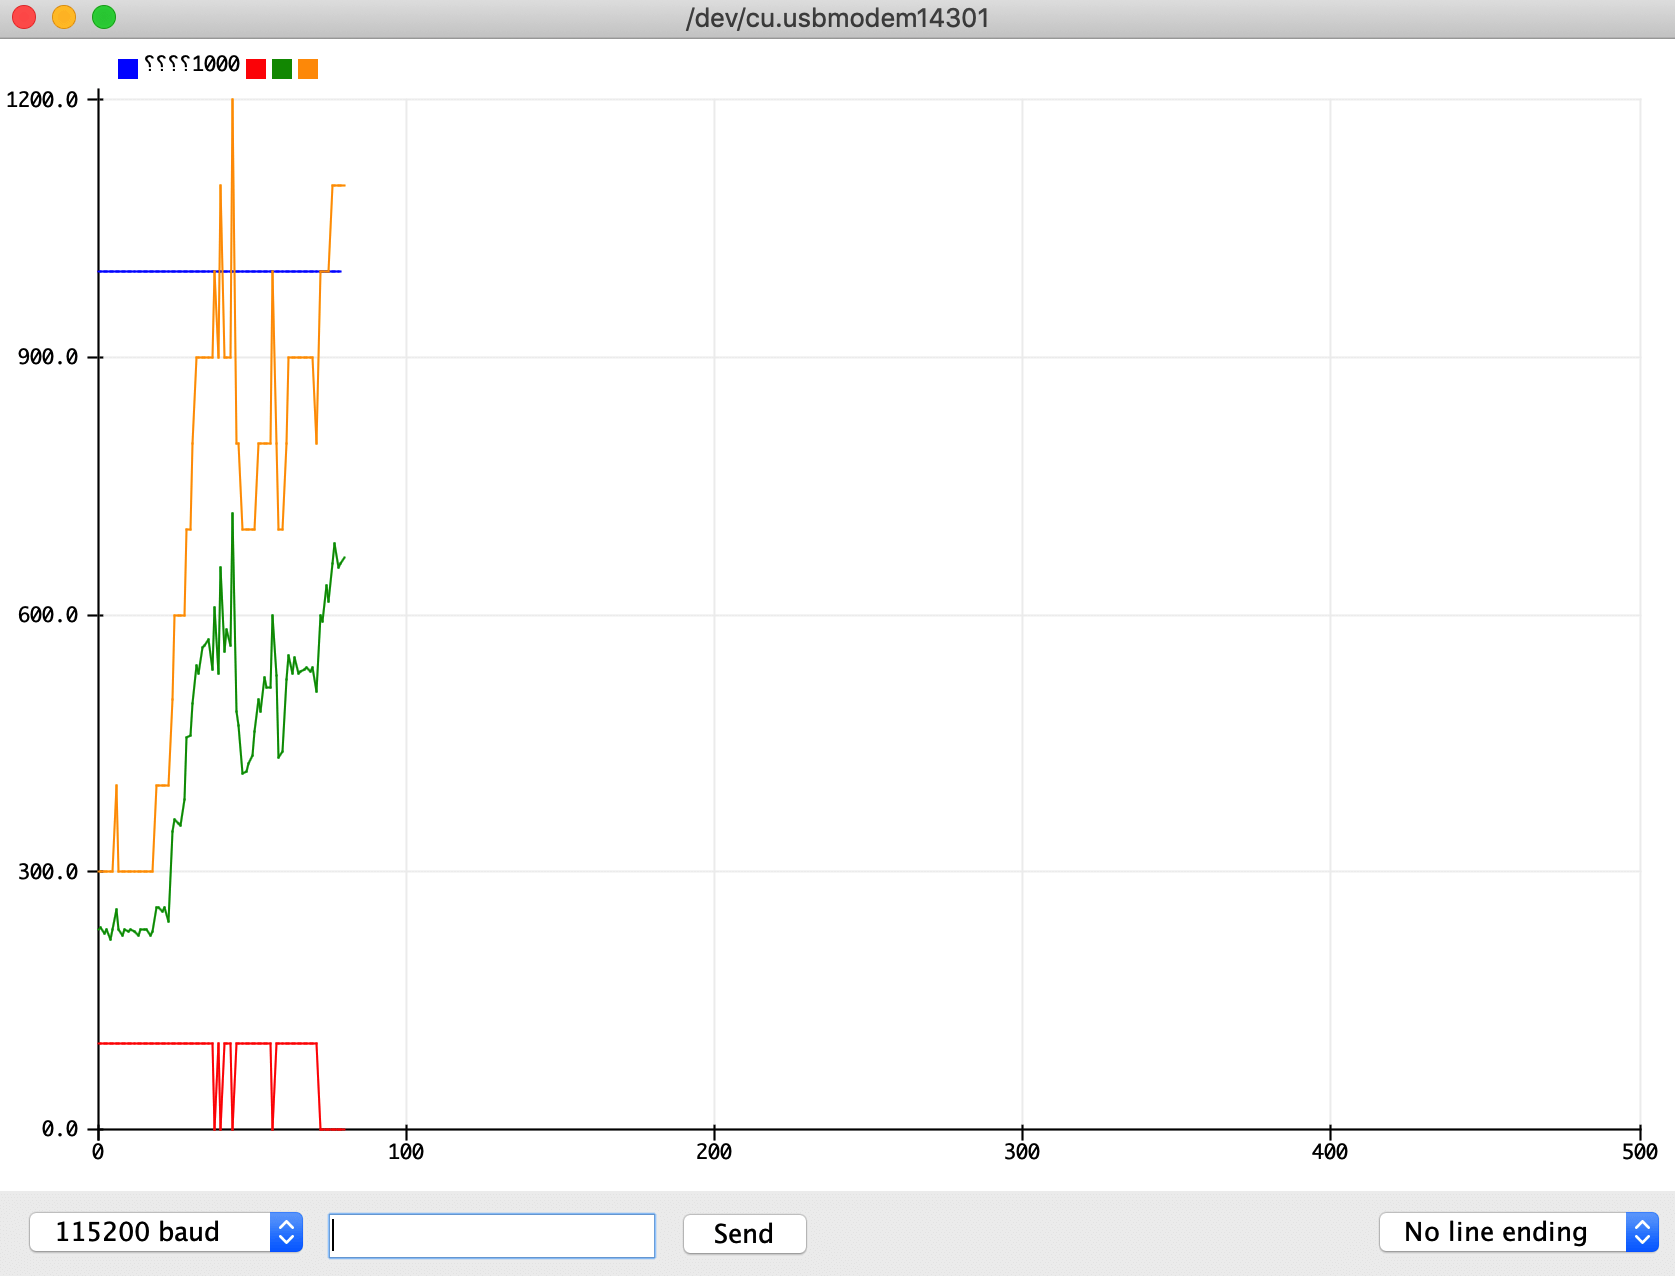
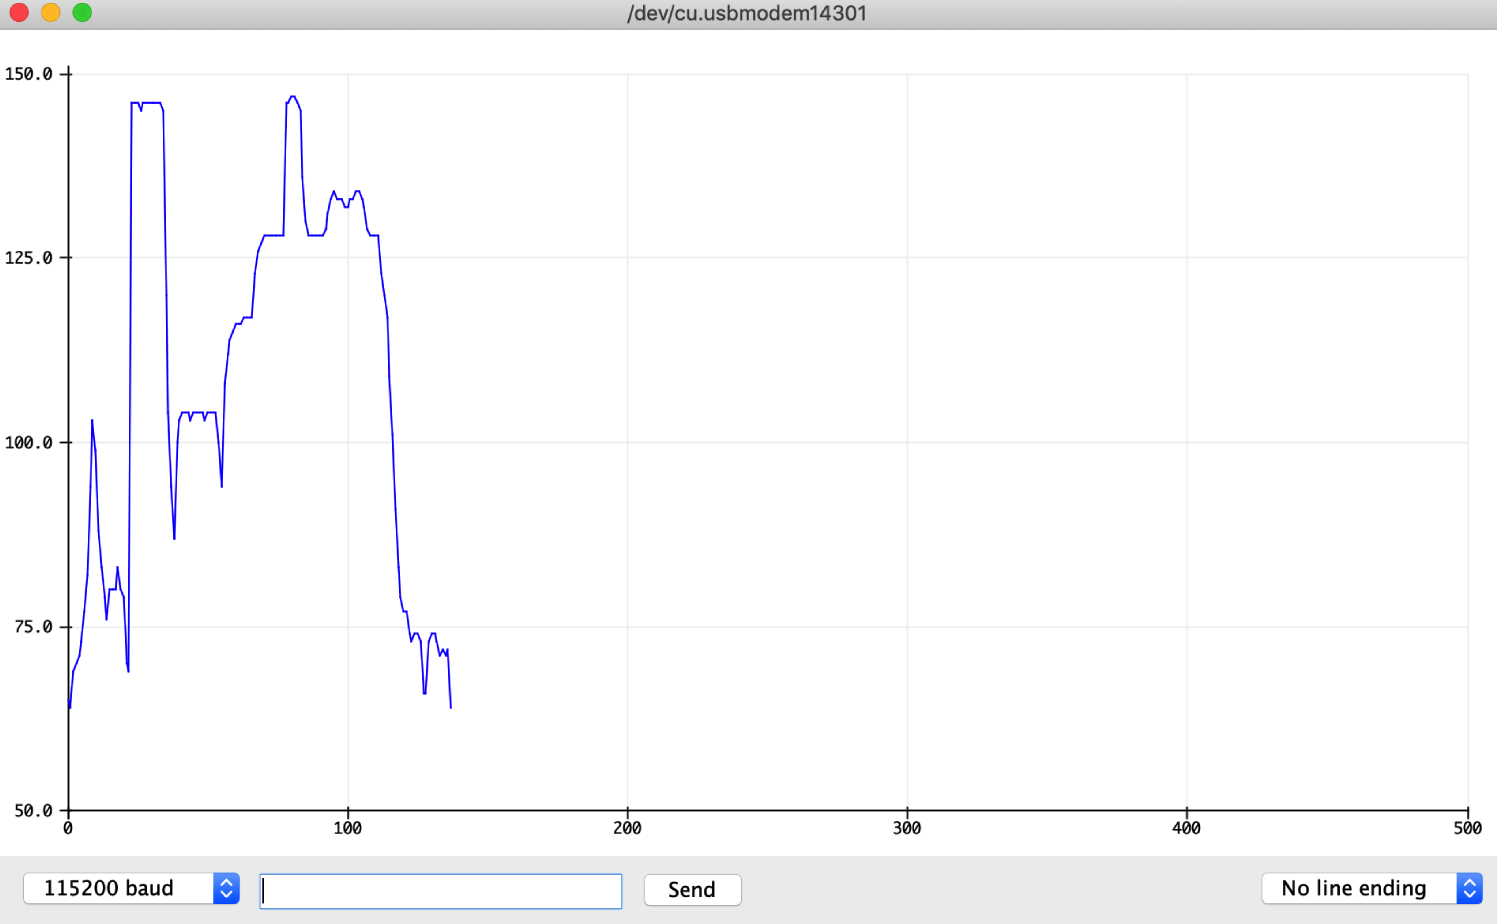
In order to see a graph of the digital and analog signals, I had to use Arduino IDE and its Serial Plotter. The values were modified a bit in order to be displayed as a nicer graph. Here I have the blue line as the 10cm threshold * 100, the red line as the digital state of the LED * 100, the green line as the measured duration, and the orange line as the measured distance * 100:
Below is the video testing whether the LED will blink according to the threshold value of 10cm:
ATtiny1614 custom board
Since the custom board has more LEDs, I decided to play further with threshold processing. Based on the code I wrote, the board supposed to display certain patterns according to different ranges of distance.
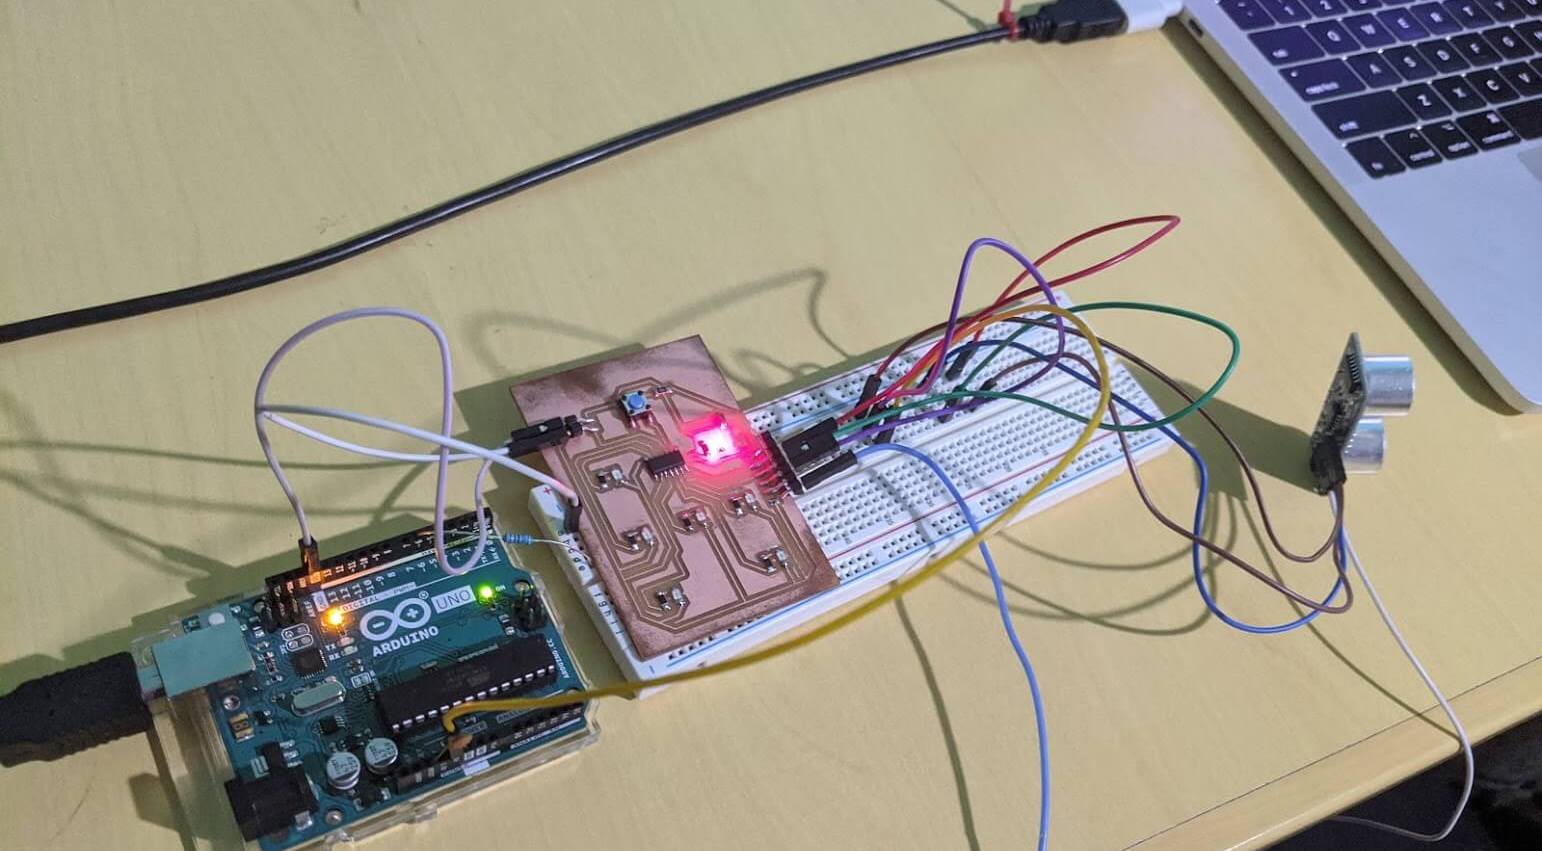
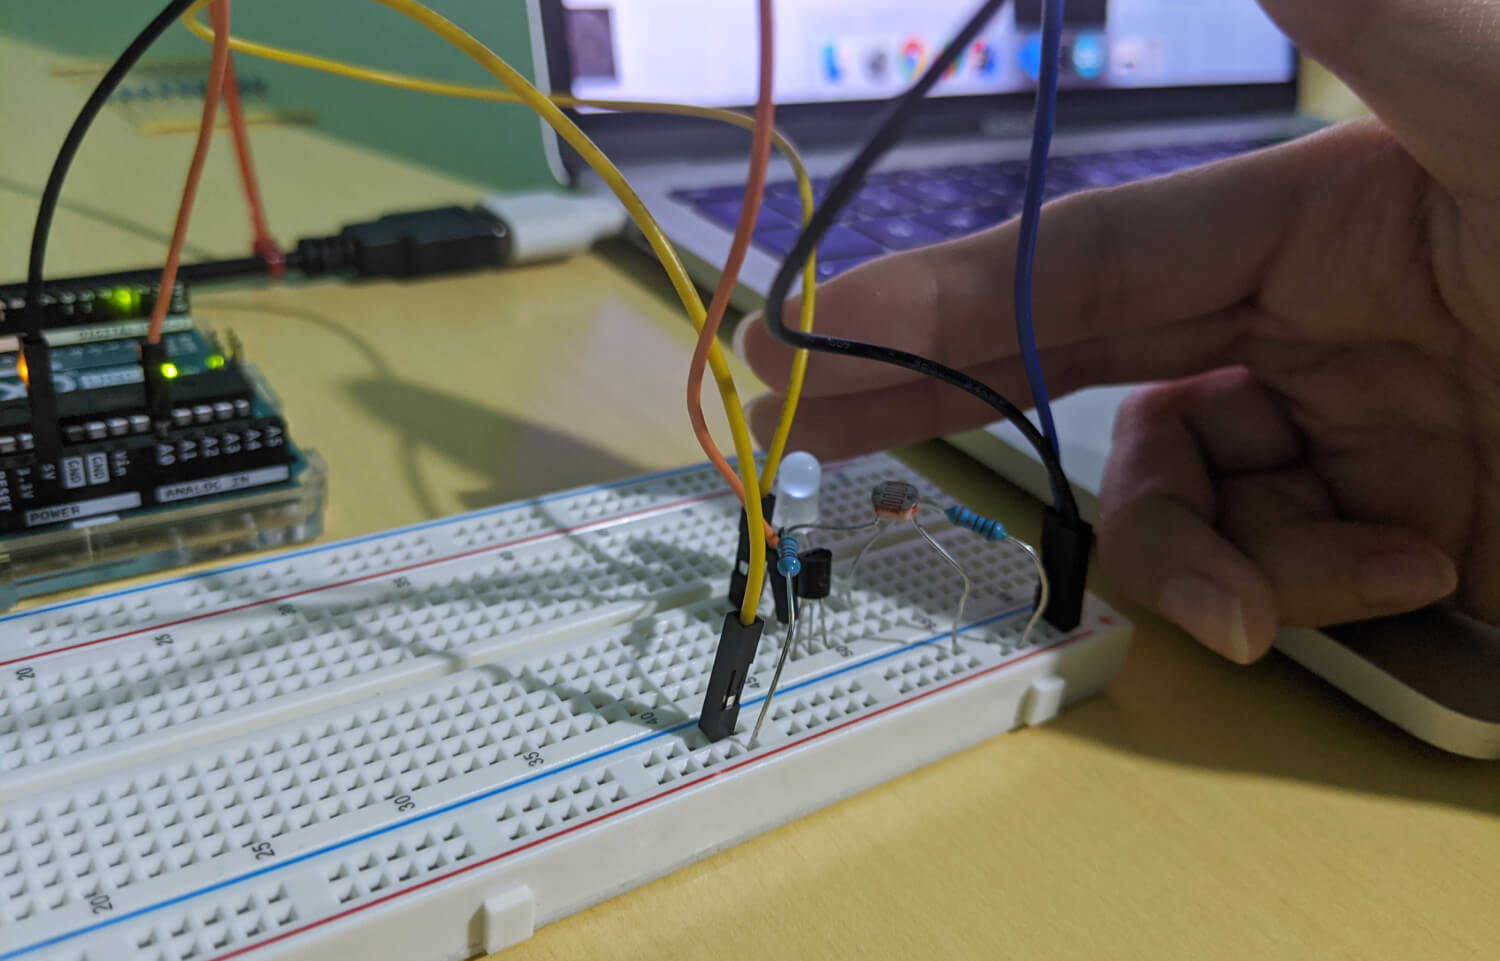
This time, the hardware connection was not that easy. Indeed, it was very complex. In summary, these were the required connections for a working Frankenstein mess:
- Pin 6 of the Arduino Uno board should be connected to the UPDI pin of the ATtiny1614 board, adding a 5K resistor. This was to program the board using Arduino Uno as the UPDI programmer.
- A capacitor 10uF was added between GND and RESET pins of the Arduino Uno board in order to disable auto-reset.
- All GND pins should be connected together: the GND pin of the Arduino Uno board was connected to GND pin/UPDI header of the ATtiny1614 board, and GND pin/FTDI header of the ATtiny1614 board was connected to the GND pin of the sensor.
- All VCC pins should be connected together: the 5V pin of the Arduino Uno board was connected to the breadboard, and the VCC pins of both the ATtiny1614 board and the sensor were connected to it.
- I connected 2 UART pins of the ATtiny board to the echo and trigger pins of the sensor. We should pay attention to the input/output (-/+) directions while plugging the pins to the breadboard.
The board was not working and I realized the reason was because I connected the UART pins with the ultrasonic sensor, and then the ATtiny1614 board was confused about the purposes of pin 4 and pin 5. I had to go to Tool > UART pins in Arduino IDE and changed the UART pins from pin 4, 5 to pin 8, 9.
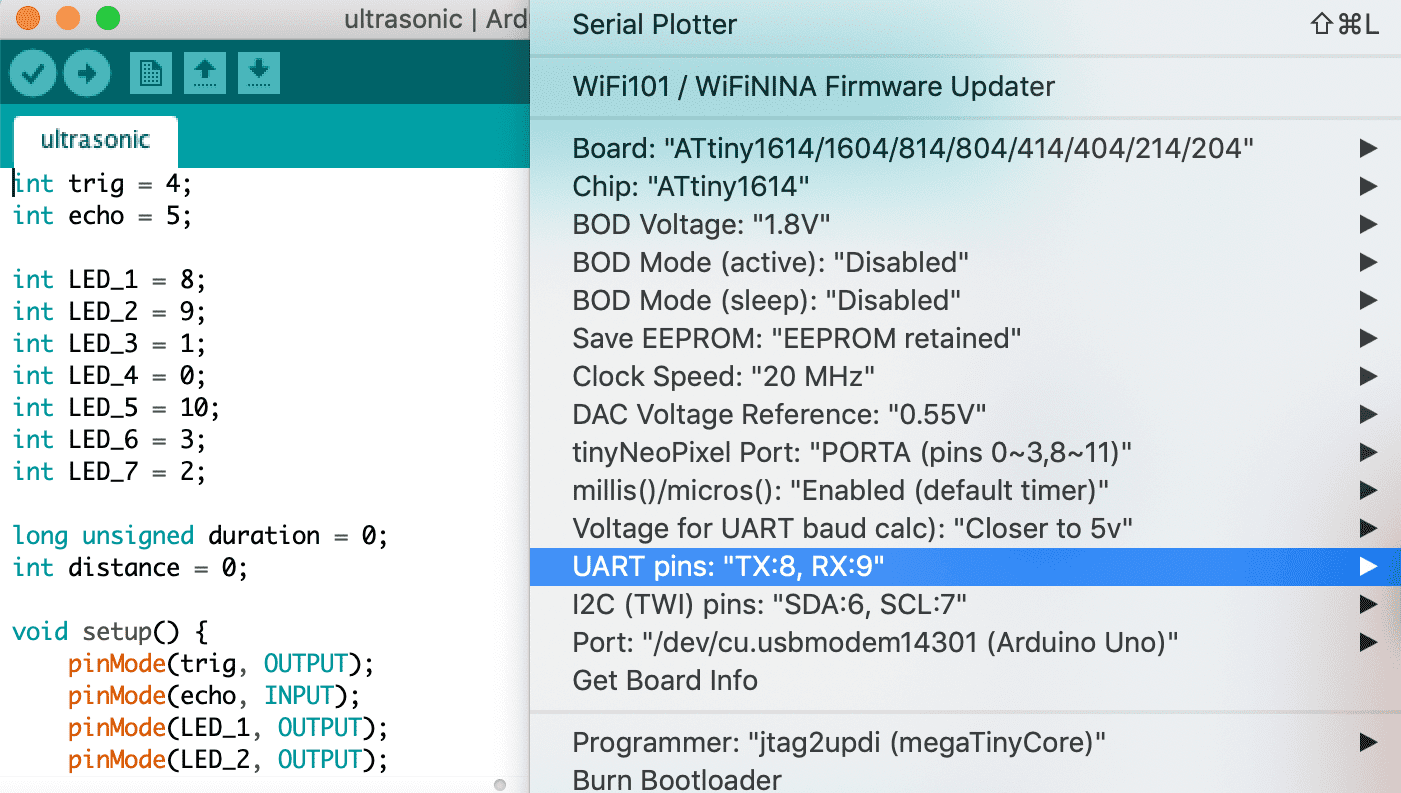
I intended to use all 7 LEDs to display 7 patterns based on 7 ranges of distance. However, because pin 8 and 9 were already used as UART pins, weird patterns were displayed. In the end, I can only display 3 different LED patterns based on 3 ranges of distance. Finally, the board behaved the way I want it to! What I learned from this test actually helped me a lot with understanding how to design a board with built-in sensors or a breakout board! Very helpful exercise!
Making and testing DIY sensors
Additional test - LDR darkness/proximity sensor
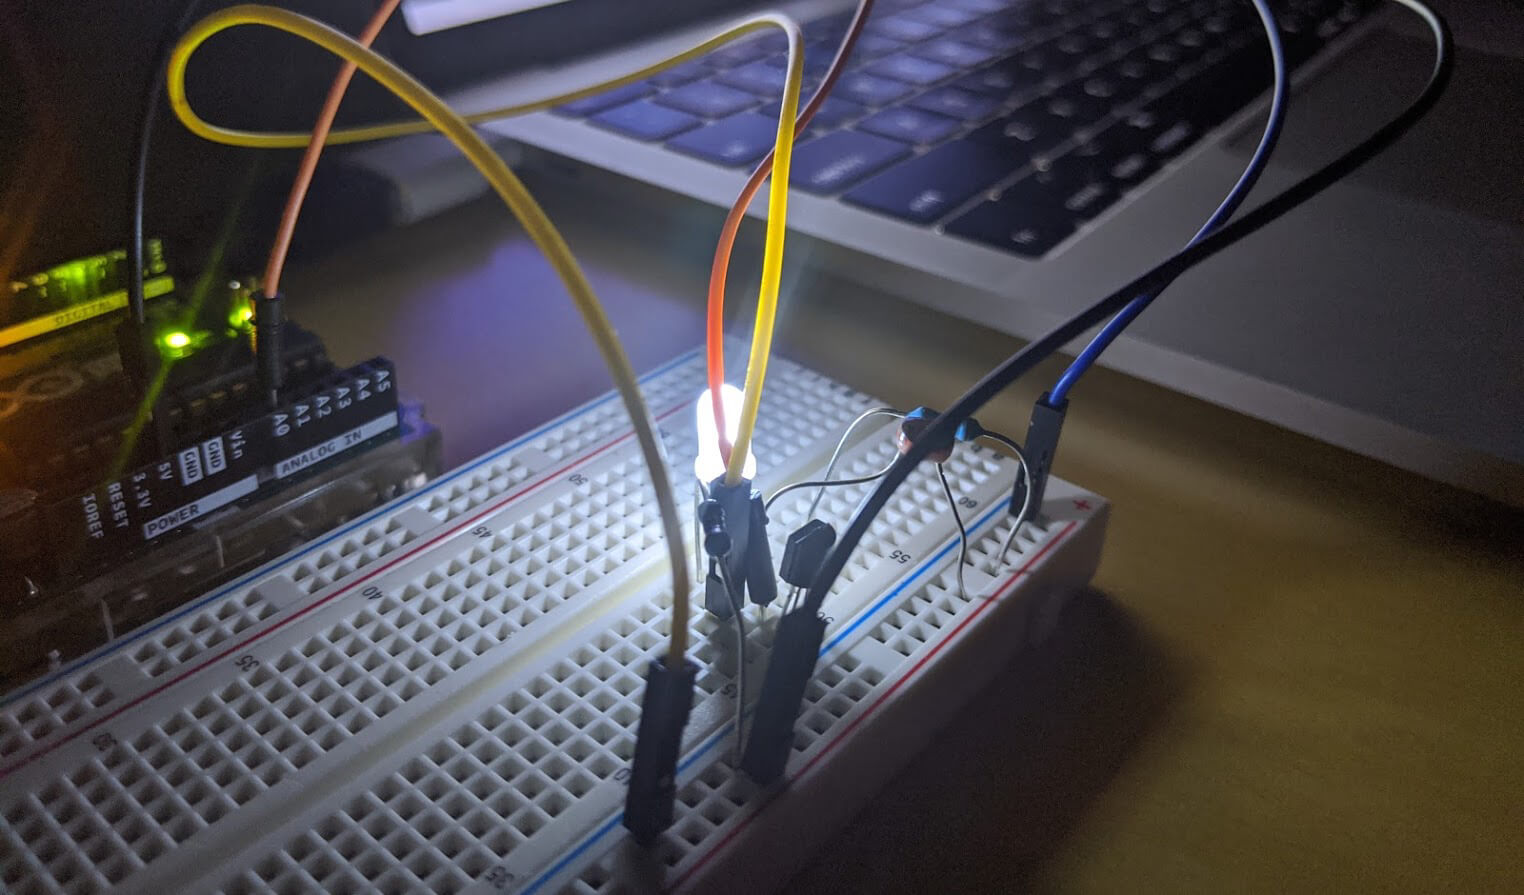
An LDR is a component that has a variable resistance that changes with the light intensity that falls upon it: in the dark, its resistance increases; however in light, its resistance decreases. The resistance of an LDR may typically have around 5KΩ in daylight and 1MΩ in darkness. Last week I used Arduino code to turn on the LED in accordance with the analog values from the LDR. This week, I intended to use a transistor as a switch. In short, a transistor conducts current across the collector-emitter path only when a voltage is applied to the base. When no base voltage is present, the switch is off. When a base voltage is present, the switch is on. By using the LDR to bias a transistor, we can make a transistor switch power to a load depending upon the light conditions.
I followed this tutorial to make a DIY darkness sensor using the LDR and a 2N222 transistor. An LED added to the circuit would be turned on or off depends on the light condition. The dark sensor circuit works in the way that if no light falls on the LDR, the LDR's resistance increases. So the voltage at the base of the transistor increases when the brightness of light decreases, and once it gets past the minimum threshold voltage required at the base of the transistor, it turns on the LED. I was also thinking that this concept could be used to understand how an IR proximity sensor works, more or less. Detailed schematic diagram is described in the tutorial.
Below is the code I used to read signals in Arduino IDE. The sensor pin (A0) was connected to one leg of the LDR (the leg that was connected to the middle leg of the transistor):
    int sensorPin = A0;
    int sensorValue = 0;

    void setup() {
        Serial.begin(112500);
    }

    void loop() {
        sensorValue = analogRead(sensorPin);
        Serial.println(sensorValue);
        delay(1000);
    }
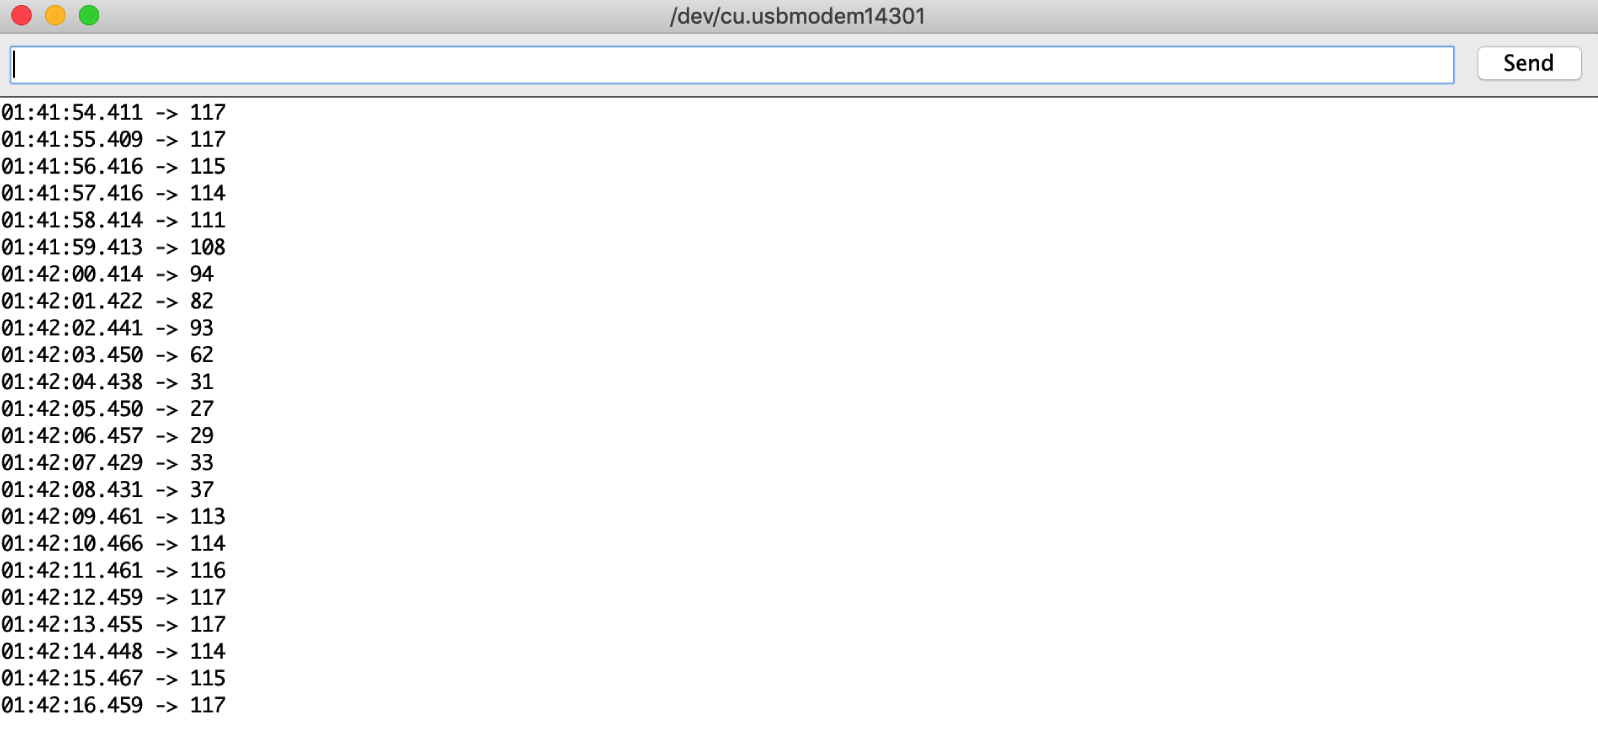
Below is the voltage data printed out in the serial monitor, the closer to the LDR my finger was, the higher the number:
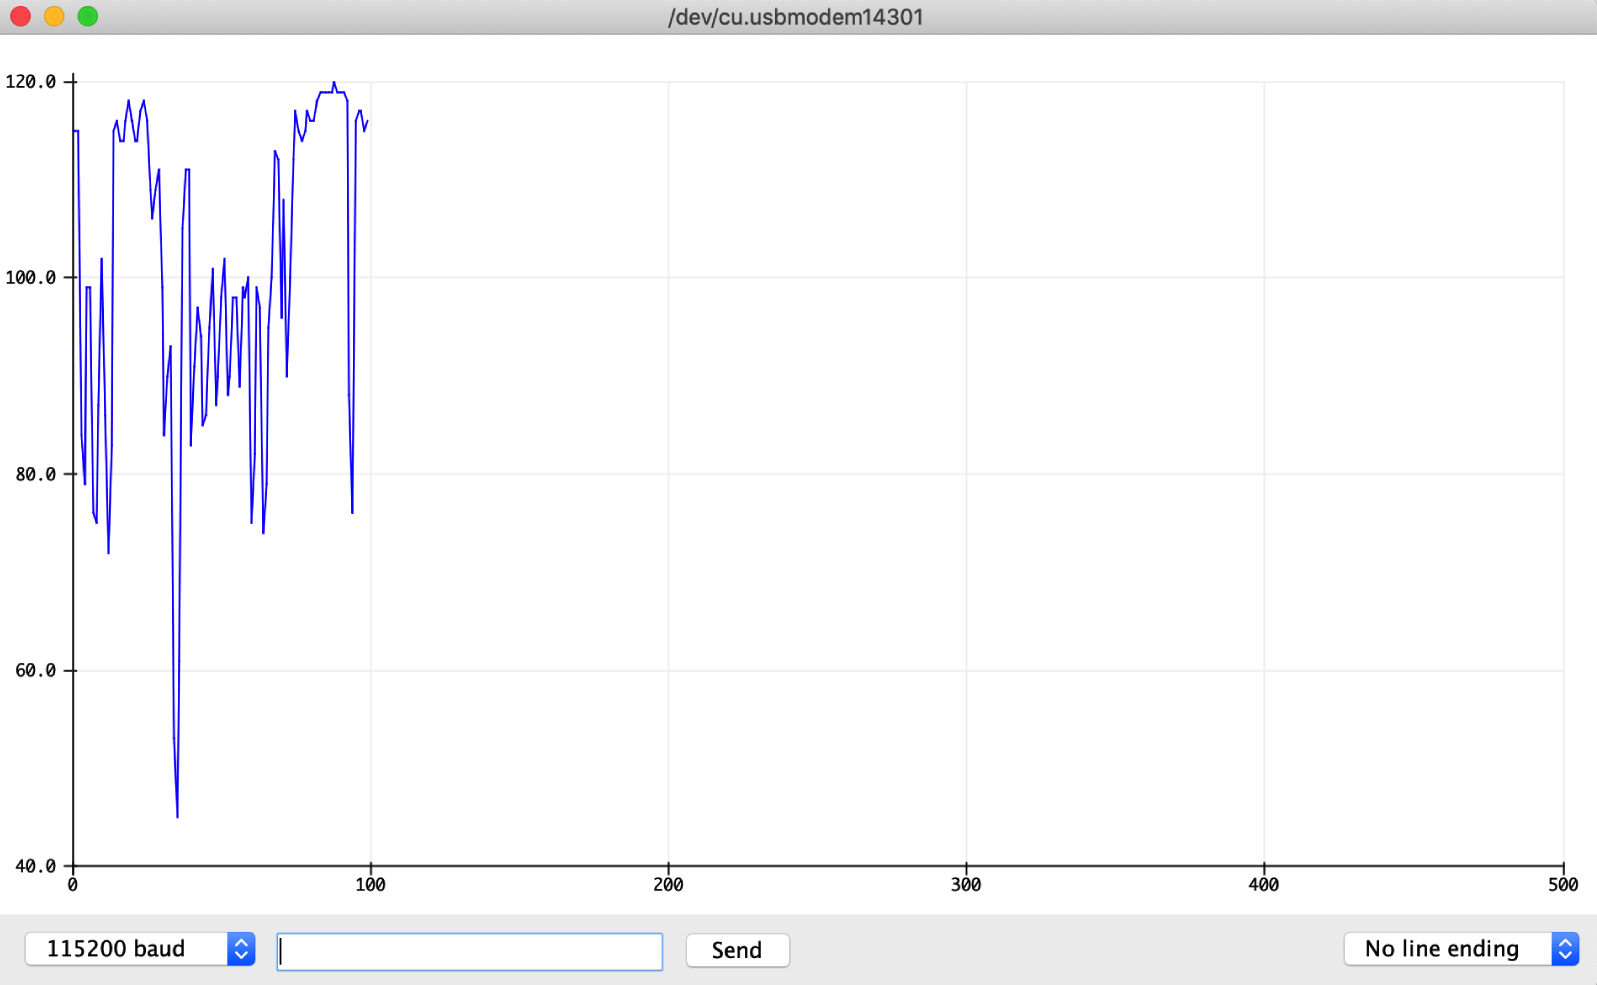
Analog values displayed in the serial plotter:
Below is the demo video of how the circuit worked:
Additional test - LDR light sensor
I followed the same tutorial and used the same code to work on the light sensor. The only difference between the 2 circuits was the placement of the LDR and the 100KΩ resistor. The light sensor circuit works in the opposite of what we saw with the dark sensor circuit: when the brightness of light increases, the LDR's resistance reduces and so the voltage at the base of transistor increases. Once this voltage increases above the required threshold voltage at the base, the LED turns on. Detailed schematic diagram is described in the tutorial.
Below is the voltage data printed out in the serial monitor, the more intensive the light, the higher the number:
Analog values displayed in the serial plotter:
Below is the demo video of how the circuit worked:
Additional test - LDR color sensor
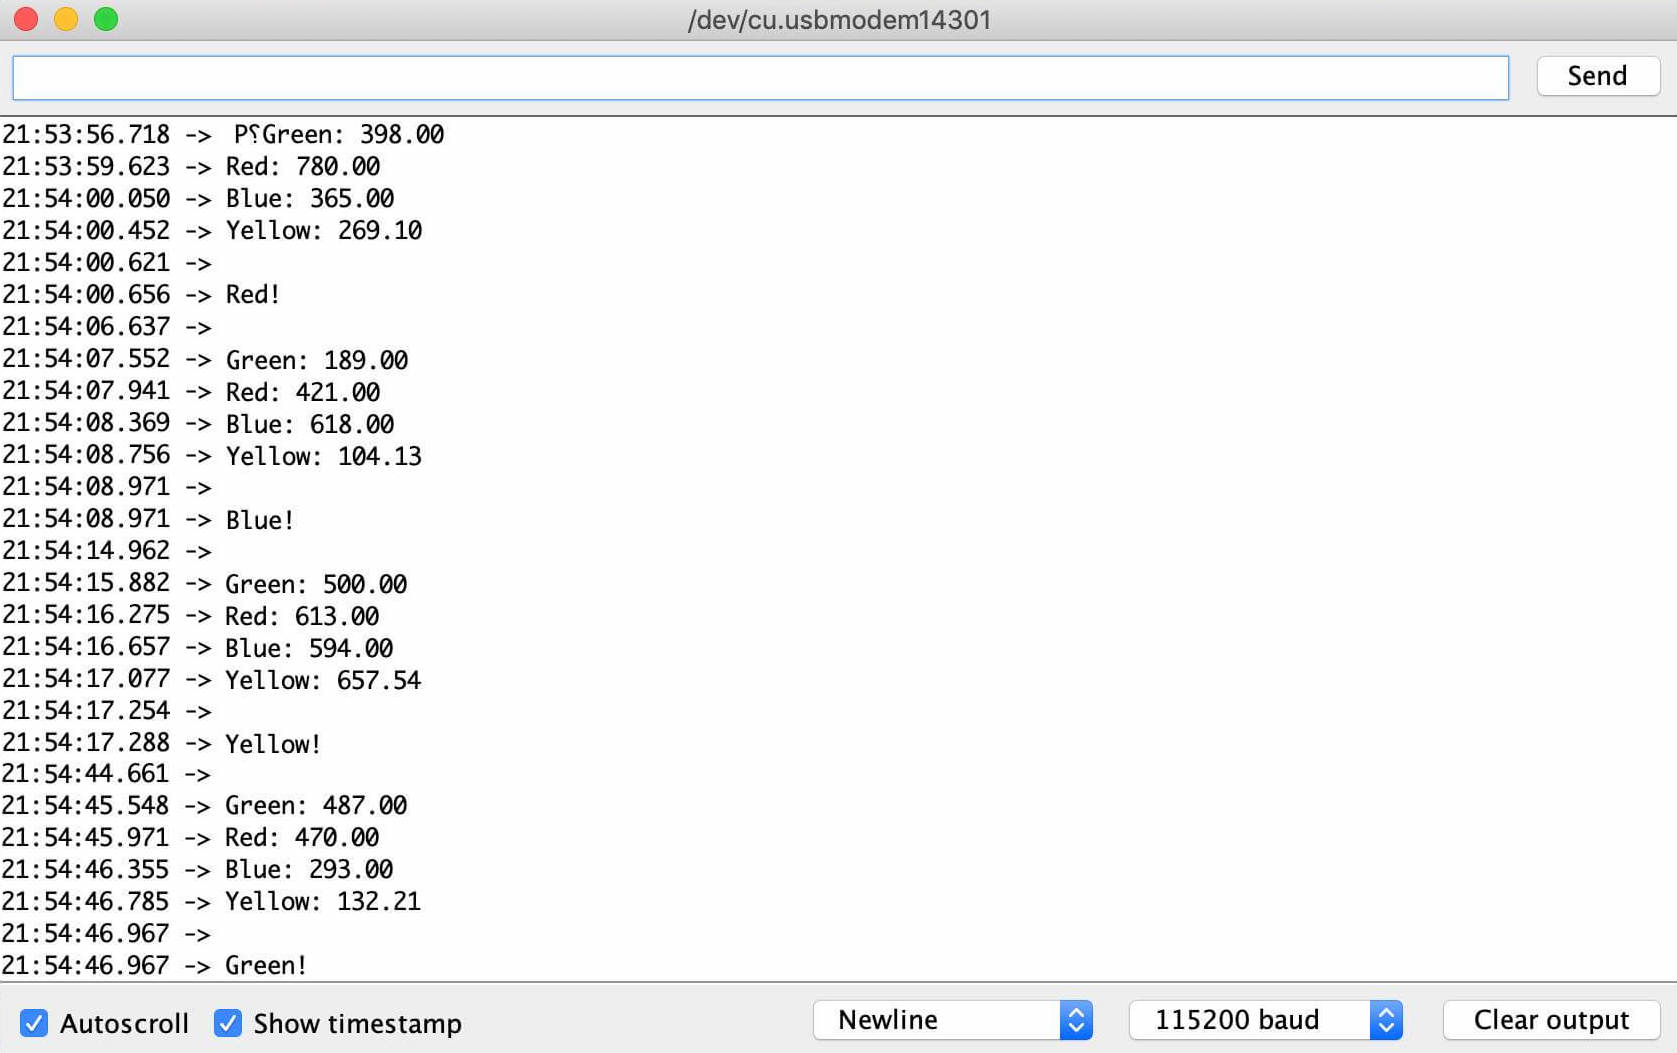
I was so impressed by the power of the tiny LDR, hence, I would like to try another DIY circuit using it. Besides, one of the Final Project ideas that I abandoned was a color detector, therefore, I followed this tutorial to wire an RGB color sensor circuit. The color sensor contained LEDs that illuminated the surface of the object. The LEDs blinked sequentially and the highest amount of light reflected back by the material surface while illuminated with the red, blue, green, and yellow LEDs was converted to voltage, then we can detect the color based on that. Detailed schematic diagram is described in the tutorial.
Below is the code from the tutorial. I modified it a bit and explained what I understand:
    /*
     * pin variables
     */
    int ldr = 0;
    int b = 2;
    int r = 3;
    int g = 4;
    int y = 5;

    /*
     * begin the serial communication and set all elements to OUTPUT
     */
    void setup()
    {
        pinMode(y, OUTPUT);
        pinMode(r, OUTPUT);
        pinMode(g, OUTPUT);
        pinMode(b, OUTPUT);
        pinMode(ldr, INPUT);
        Serial.begin(112500);
    }

    /*
     * loop() function
     */
    void loop()
    {
        allOff();
        delay(200);
        check();
    }

    /*
     * check color of the object
     */
    void check()
    {
        delay(500);
        /*
         * measure the voltage of the LDR from the beginning, with the immediate surroundings
         */
        double ambient = analogRead(ldr);

        /*
         * measure the voltage of the LDR after blinking the green LED
         */
        digitalWrite(g, HIGH);
        delay(200);
        double green = analogRead(ldr);
        Serial.print("Green: ");
        Serial.println(green * 1.0);
        digitalWrite(g, LOW);
        delay(200);

        /*
         * measure the voltage of the LDR after blinking the red LED
         */
        digitalWrite(r, HIGH);
        delay(200);
        double red = analogRead(ldr);
        Serial.print("Red: ");
        Serial.println(red * 1.0);
        digitalWrite(r, LOW);
        delay(200);

        /*
         * measure the voltage of the LDR after blinking the blue LED
         */
        digitalWrite(b, HIGH);
        delay(200);
        double blue = analogRead(ldr);
        Serial.print("Blue: ");
        Serial.println(blue * 1.0);
        digitalWrite(b, LOW);
        delay(200);

        /*
         * measure the voltage of the LDR after blinking the yellow LED
         * I don't really understand why but according to the tutorial
         * I had to apply a factor of 1.17 to the yellow LED in order to get the correct result
         * maybe something with the forward voltage Vf?
         */
        digitalWrite(y, HIGH);
        delay(200);
        double yellow = analogRead(ldr);
        Serial.print("Yellow: ");
        Serial.println(yellow * 1.17);
        digitalWrite(y, LOW);
        delay(200);

        /*
         * calculate the R,G,B,Y data
         * and detect the color = the piece of data with highest value
         */
        double rawData[] = {(green * 1.0), (red * 1.0), (blue * 1.0), (yellow * 1.17)};
        double maximum = ambient * 1.0;
        int color;

        for (int i = 0; i < 4; i++)
        {
            if (maximum < rawData[i])
            {
                maximum = rawData[i];
                color = i+1;
            }
        }

        Serial.println("");
        /*
         * print the result to serial monitor
         */
        if (color == 0)
        {
            Serial.println("No object detected.");
            allOn();
            delay(1000);
            allOff();
        }
        else if (color == 1)
        {
            Serial.println("Green!");
            pulse(g);
        }
        else if (color == 2)
        {
            Serial.println("Red!");
            pulse(r);
        }
        else if (color == 3)
        {
            Serial.println("Blue!");
            pulse(b);
        }
        else if (color == 4)
        {
            Serial.println("Yellow!");
            pulse(y);
        }
        Serial.println("");
    }

    /*
     * announce the detected color by blinking the related LED
     */
    void pulse(int color)
    {
        for(int i = 0; i < 3; i++)
        {
            digitalWrite(color, HIGH);
            delay(1000);
            digitalWrite(color, LOW);
            delay(1000);
        }
    }

    void allOff()
    {
        digitalWrite(y, LOW);
        digitalWrite(r, LOW);
        digitalWrite(g, LOW);
        digitalWrite(b, LOW);
    }

    void allOn()
    {
        digitalWrite(y, HIGH);
        digitalWrite(r, HIGH);
        digitalWrite(g, HIGH);
        digitalWrite(b, HIGH);
    }
And here we have the wired circuit and testing objects! Ready to test!
In fact, I couldn't use the small objects to test the program. I had to wrap my colorful sweaters around the whole breadboard in order to ensure better reflections and more accurate results. Otherwise, the sensor kept detecting the red color of my fingers.
Designing and making a board with sensors
This week seemed to be a good time for me to start thinking about how to design the electronics parts of my Final Project. I planned to use the ESP32 chip as the central micro-controller that will manipulate all the input and output devices. I also bumped into this article while studying the ESP32 and ESP8266 chips, and the multi-sensor shield seemed to be what I was looking for. Shields are modular circuit boards that piggyback onto the micro-controller board and instill it with extra functionalities. I found many Arduino shields while researching, and Raspberry Pi also has hardware with a similar concept called HAT. Shields usually have the same form-factor as the micro-controller board and it's important to make sure there is no overlapping usage of pins when stacking shields. I really fancied the idea of stacking shields to create a BIG MAC of circuits, so I went ahead to give it a try this week.
Individual assignment - Design the ESP32 board and its multi-sensor shield
Designing the ESP32 board with KiCad
I decided to build on top of the Barduino 2.0 board designed by our instructor Eduardo. In order to understand the ESP32 chip's features and applications as well as how a wide range of sensors and actuators work, I went through this useful website. Here they have a full ESP32 pinout diagram with detailed notes on what to do with the GPIO pins and some examples of using an ESP32 board with sensors. They also have a section for Arduino boards with more examples regarding motors, buzzers, and other specific modules. After digesting the content of the website, I came up with these below required building blocks for my board:
- The board will have basic blocks that are exactly the same with ones from the original Barduino board, namely: the programming switch and the reset button (to flash programs to the chip), a user-programmable LED (for debugging), an FTDI area including the FTDI header and a 3.3V LDO regulator (to convert higher voltage from USB and the battery to a 3.3V voltage that is not damaging to the ESP32 chip).
- The board will be powered by a battery when being packaged into my dragon. I was not so sure about available jacks at Fab Lab Barcelona, but Josep recommended LiPo batteries which usually go together with JST plugs. In addition, I was thinking about using these magnetic pogo pins or these male and female connectors to connect the boards electrically, with or without transferring data I didn't know. Therefore I also added extra I2C and power headers, just in case.
- It seems like there are only +6V LiPo batteries available, that's why I added a 5V LDO regulator to the circuit. After reading the data sheet of the ZLDO1117 regulators (which is used in the Barduino board), I noticed some points: a suitable range of input voltage should be 6.4V < Vin < 12V, both of them have SOT223 SMD package available, a minimum of 4.7µF capacitor must be connected from Vout to GND to ensure stability, and all ZLDO1117-X regulators will be wired in the same way. I also referred to this tutorial to wire a circuit that allows 3.3V and 5V output from a +6V power supply. About capacitors, I followed exactly what Eduardo did, because I trust him.
- For the input sensors, I'm going to use an HC-SR04 ultrasonic sensor and an LDR. Both require 5V to operate. For the output parts, I'm thinking about having 2 SG90 micro servo motors, an addressable RGB LED strip, and an active buzzer. As far as I know, they work fine at 5V. Hence, I assumed the best strategy could be powering both the ESP32 boards and the sensor/actuator shields at around 5V, and then perform some level shiftings to input the proper voltages to some specific elements. In order to place everything except for the motors on top, I put the LED strip adapter and the buzzer in the same shield with the sensors.
- I took a look at this link in order to understand different ways of level shifting. In addition to the voltage regulator, I applied the voltage divider method to convert 5V signals from the sensors to 3.3V signals that are safe for the chip. The formula I was using is Vin/Vout = (R1 + R2)/R2. The HC-SR04 sensor can be trigger with a 3.3V signal, so that part would be fine.
- I also followed the solution from the above-mentioned link and used N-MOSFET transistors to amplify the 3.3V outputs of the chip to higher ones which the output devices might require. I was not so certain about the required voltage of the output devices yet or whether I would need loads/resistors with a specific resistance, therefore here I separated an example N-MOSFET circuit into 2 parts: the lower voltage side will be handled by the ESP32 board, and the higher voltage side will be handled by the motor shield. Little did I know that I would face problems using the MOSFETs soon after, but that would be discussed better in the 11th week.
Below is the first version of my KiCad schema:
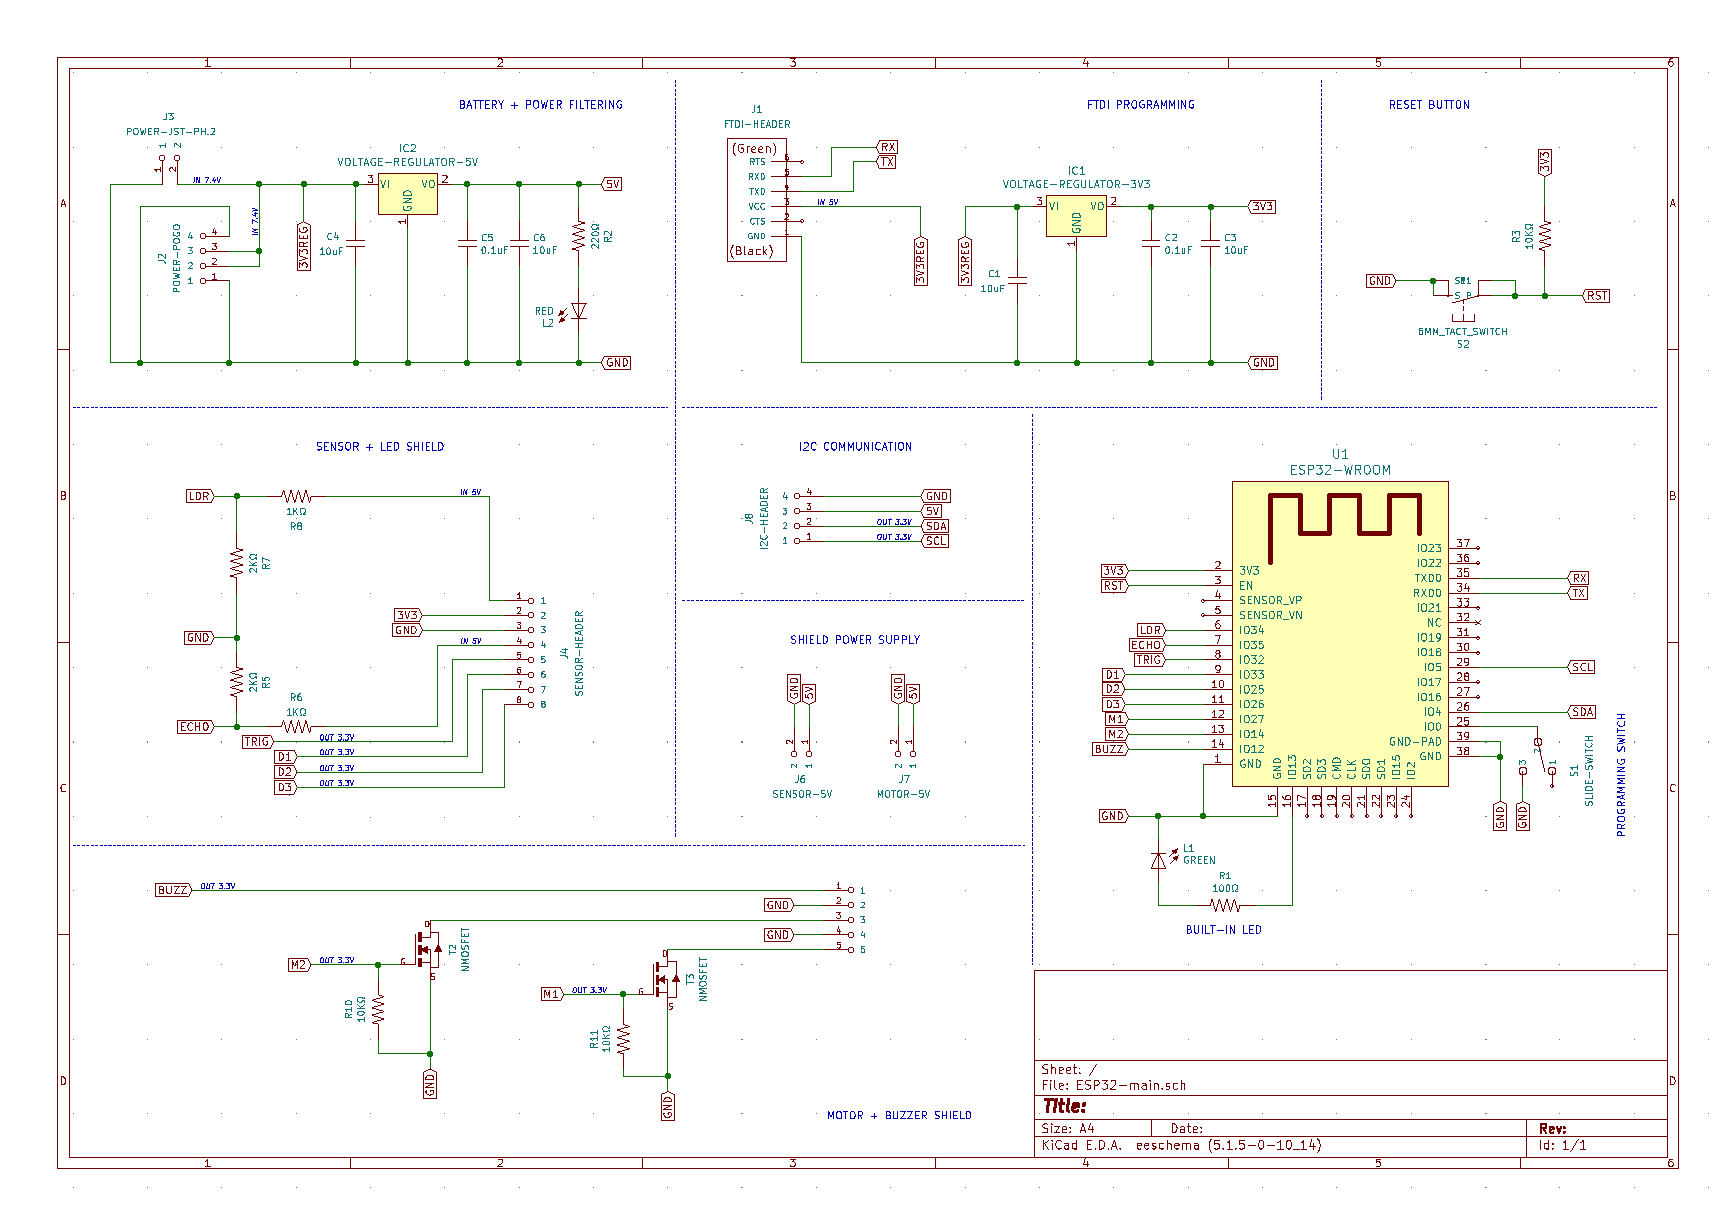
We then had an electronics debugging session with the instructors, and I made some adjustments after we discussed my PCB layout:
- I decided to include a DHT11 temperature and humidity sensor to my design.
- I also added some pull-up resistors in order to provide a default state for the I2C signal lines.
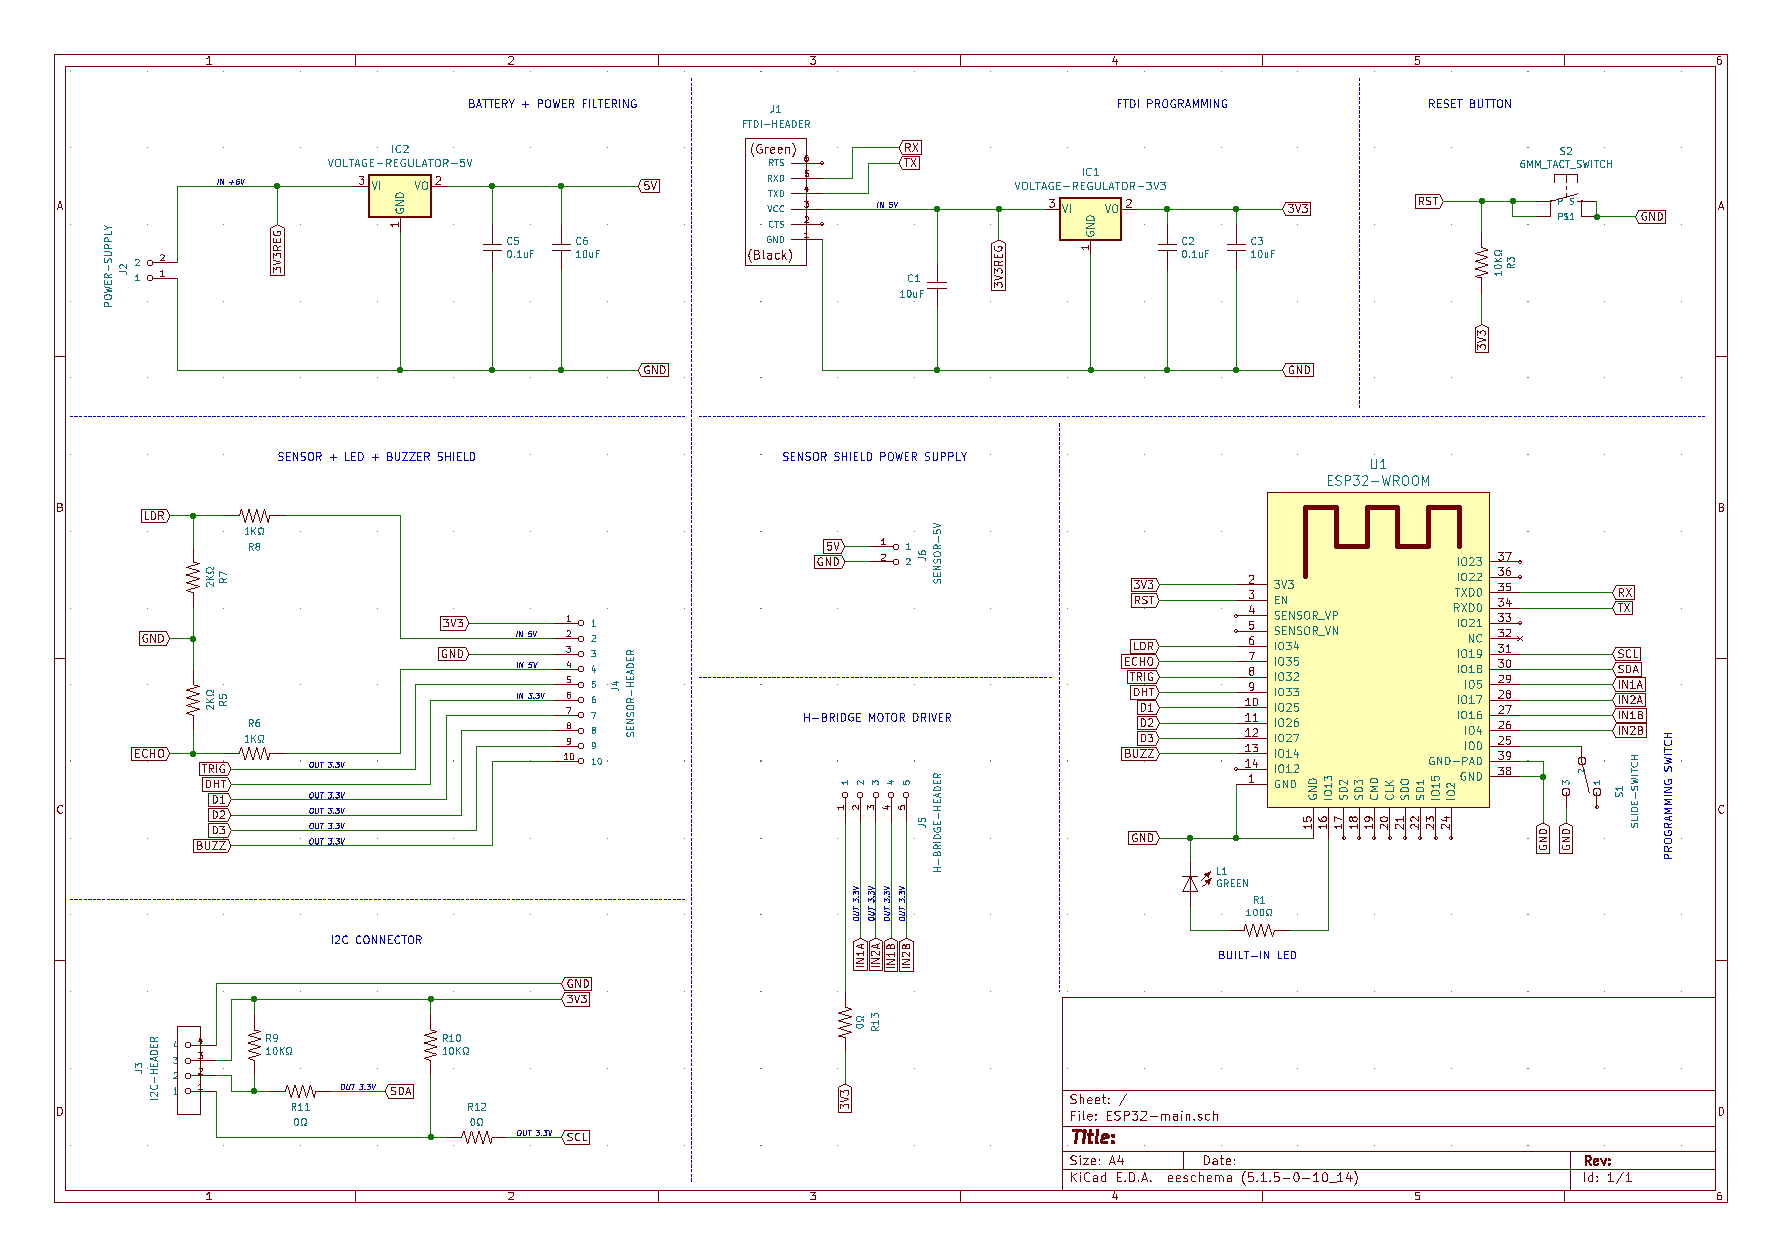
After getting back to the lab after the lockdown, I had a discussion with our instructor Eduardo and we realized that I should power the motor shield first and from that shield, power will be passed to the ESP32 board, else the current passed from the ESP32 board to the shields will be constrained to 1 Amp. So, there you go the final schema of the board:
I tried to avoid placing elements and traces near the antenna area, and added some 0Ω resistors here as soldering jumpers while routing the PCB layout:
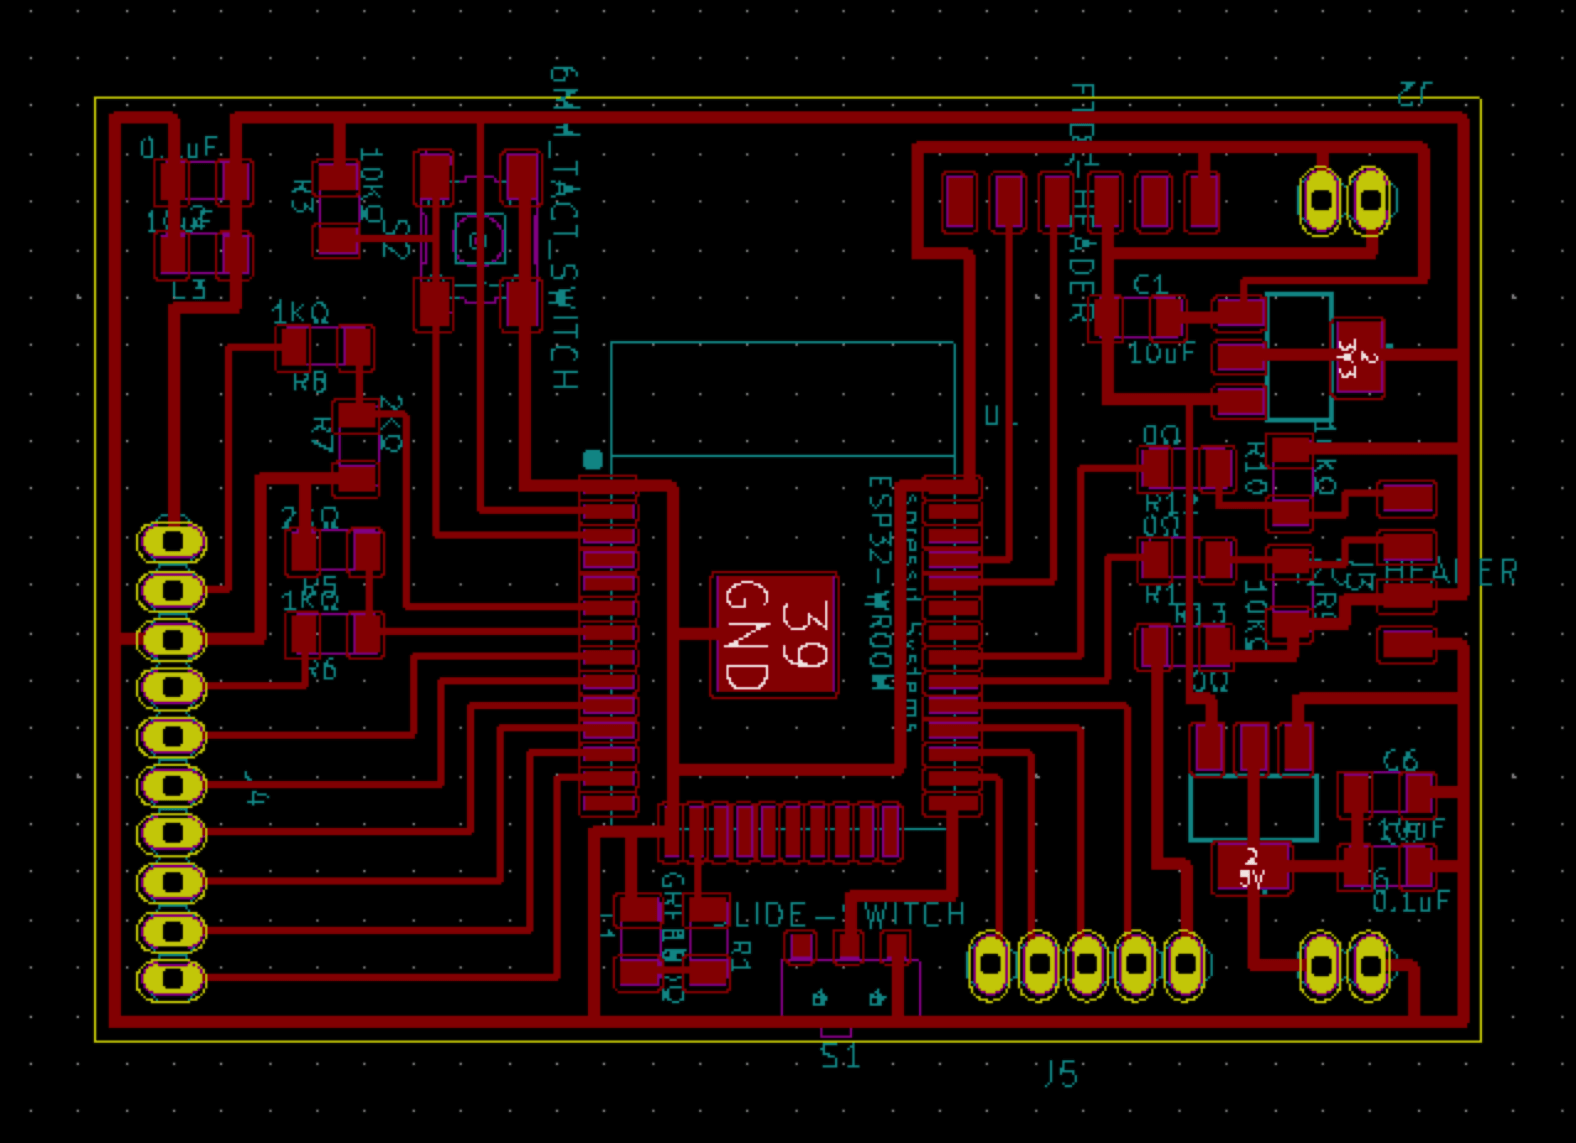
I also exported the board to .step in KiCad and then .fbx in Fusion 360 to see how it will look like after being stuffed. The reason why I spent time doing this extra thing was to imagine more clearly how I should stack the shields to the board as well as where I should plug external elements. It also helped me to estimate how big the 3D-printed housing parts (the dragon's head) should be (at the moment, something that can contain approximately 95 x 85 x 65mm electronic parts).
The layout seemed to be good, or at least I was kinda happy with it at the moment. The next step was to prepare the traces for the drilled holes. Also, the copper under the antenna area of the ESP32 chip is required to be removed (due to the Faraday cage effect, as Eduardo explained). That's why I had 3 layers exported.
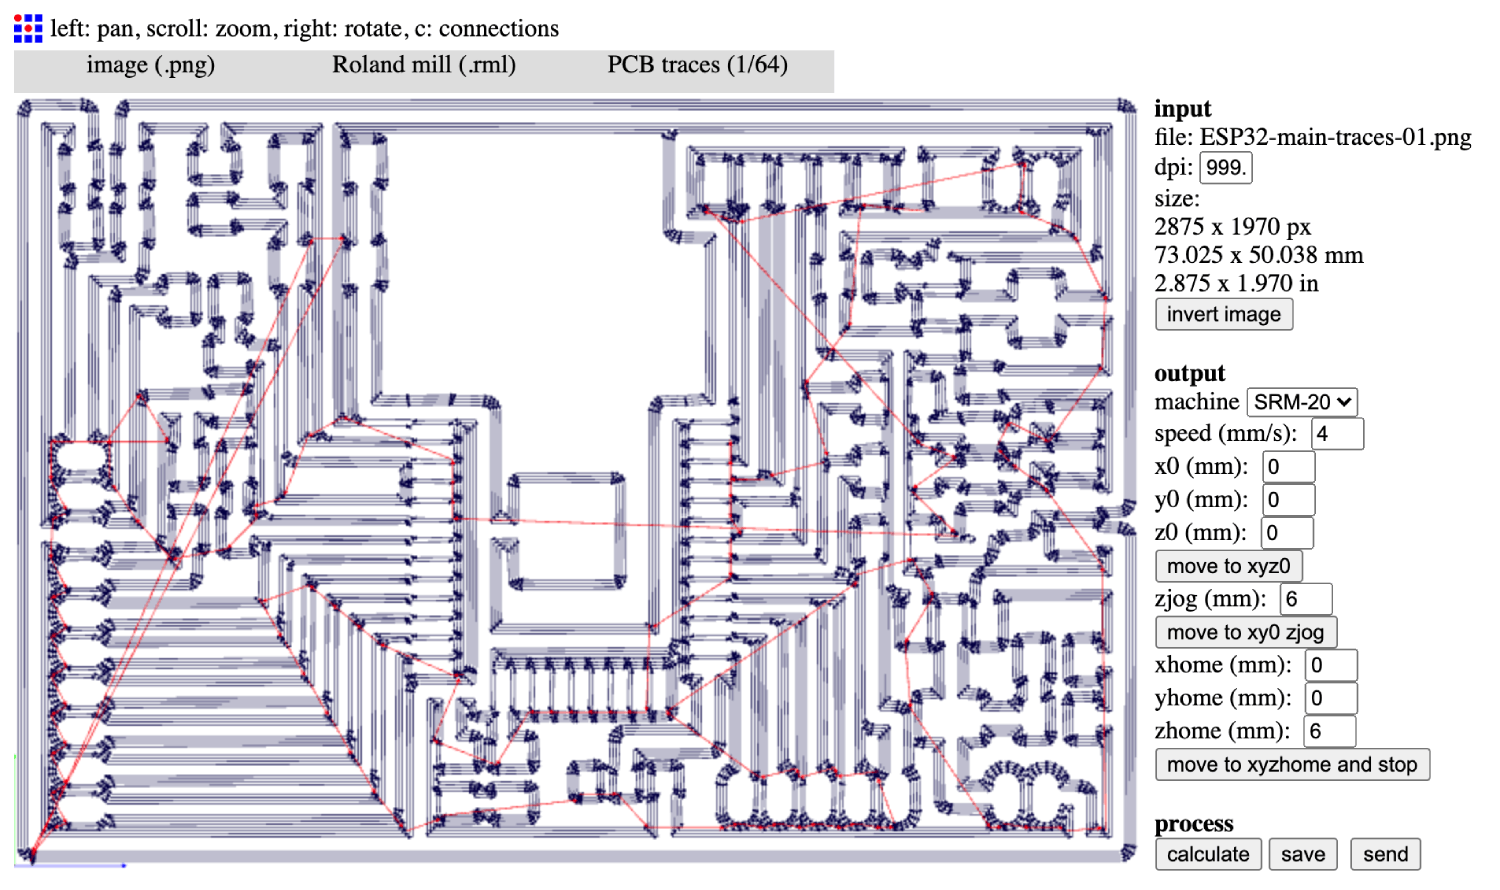
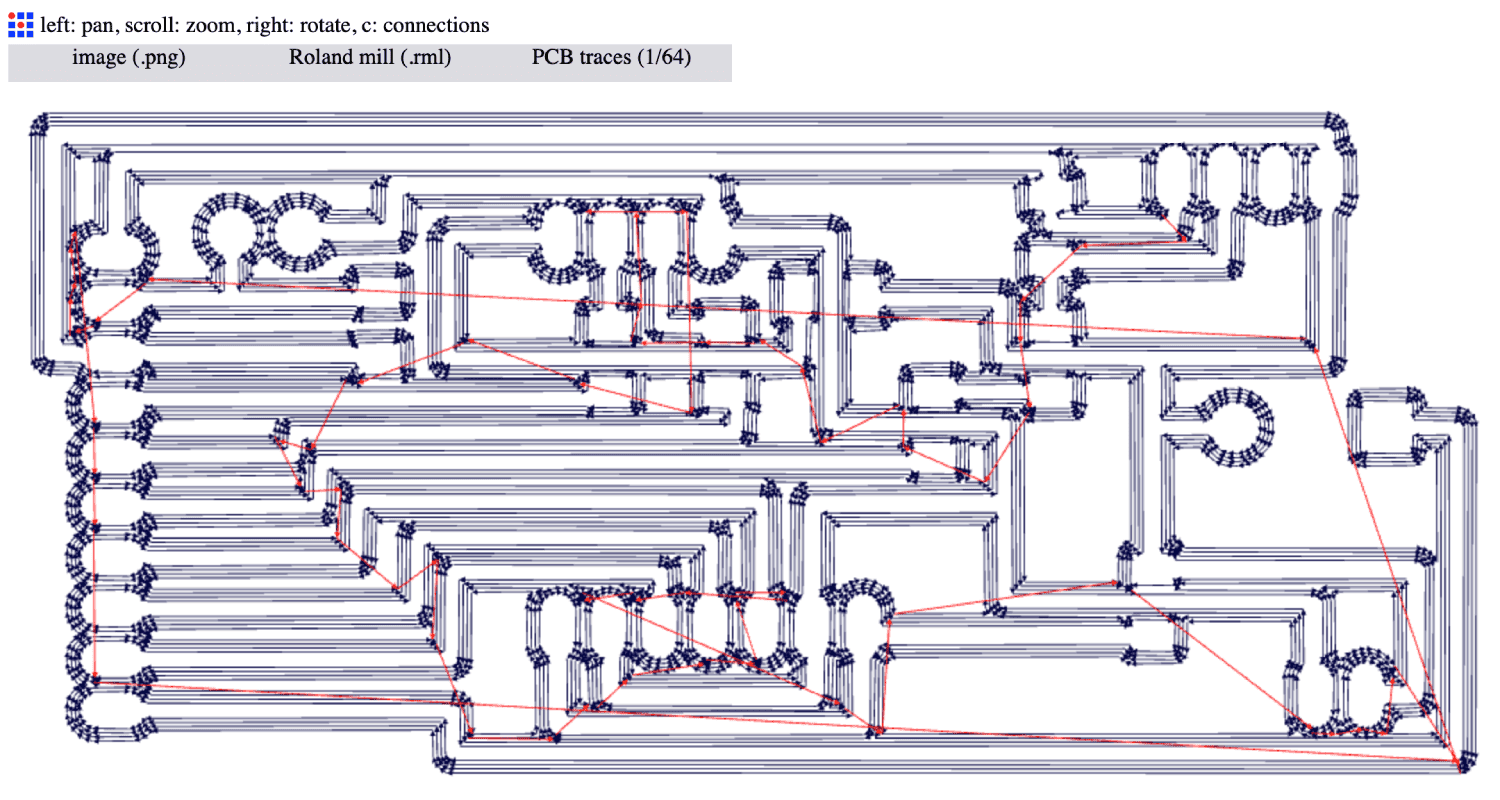
Finally, I imported the 3 .png files to Fab Modules in order to check everything again. There were some parts where the traces were a bit close to each other, but they still looked manageable since they were completely separated. Let's see, finger-crossed!
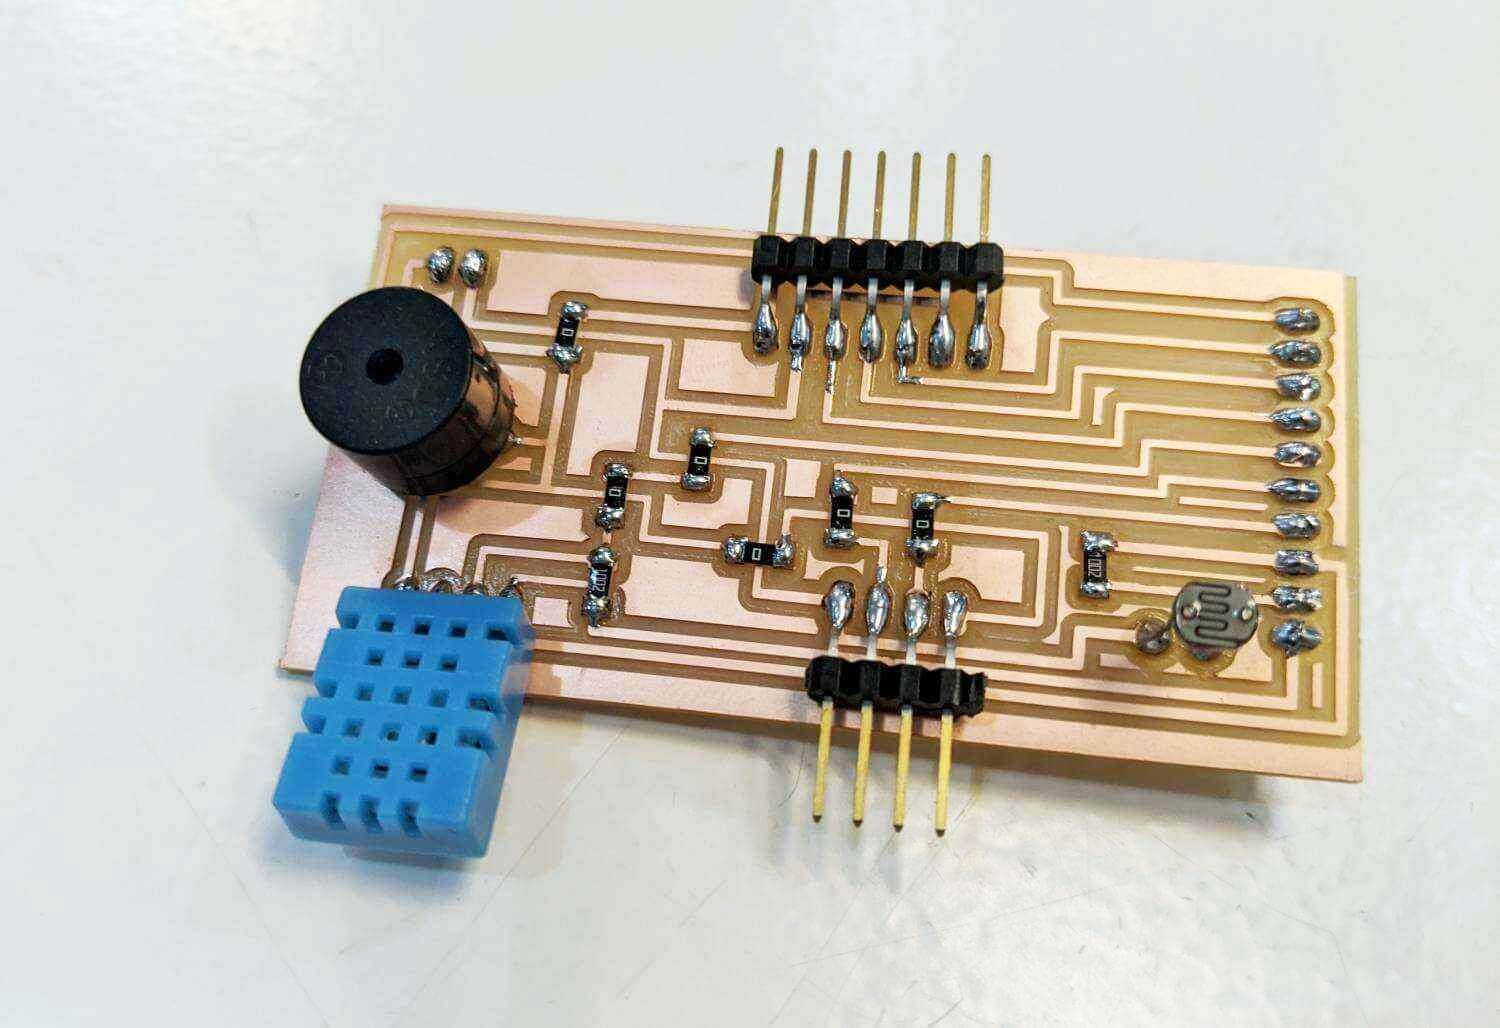
Designing the multi-sensor shield with KiCad
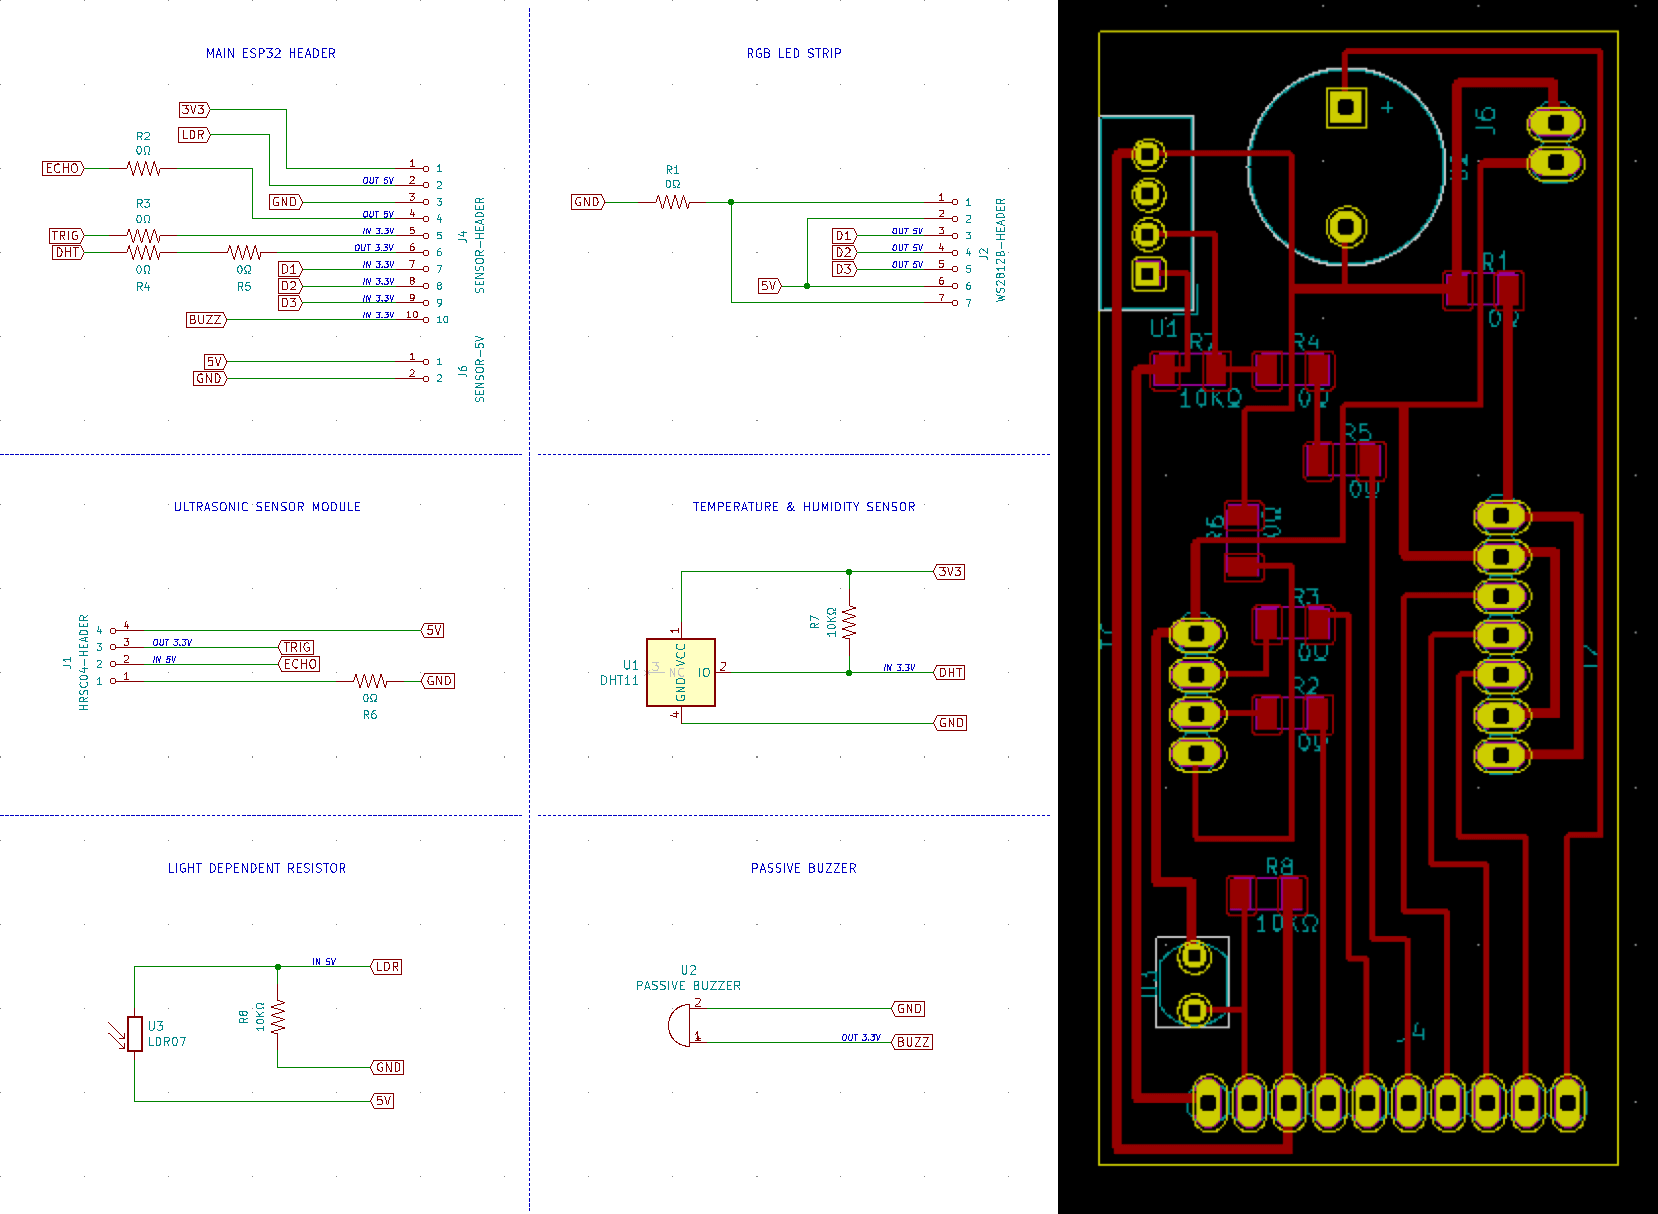
The sensor shield was indeed designed during July when we got back to the lab after the lockdown, and it was the last PCB I designed. To be honest, I was kinda tired from routing all the PCBs, so I used A LOT OF jumpers while designing it. The only thing I should pay attention to was to place the sensors and actuators in a way that will make it easier for wiring and assembling later. I have here 2 headers for the ultrasonic sensor (which will be placed at the nose of the dragon) and the LED strip (which will be placed at the teeth).
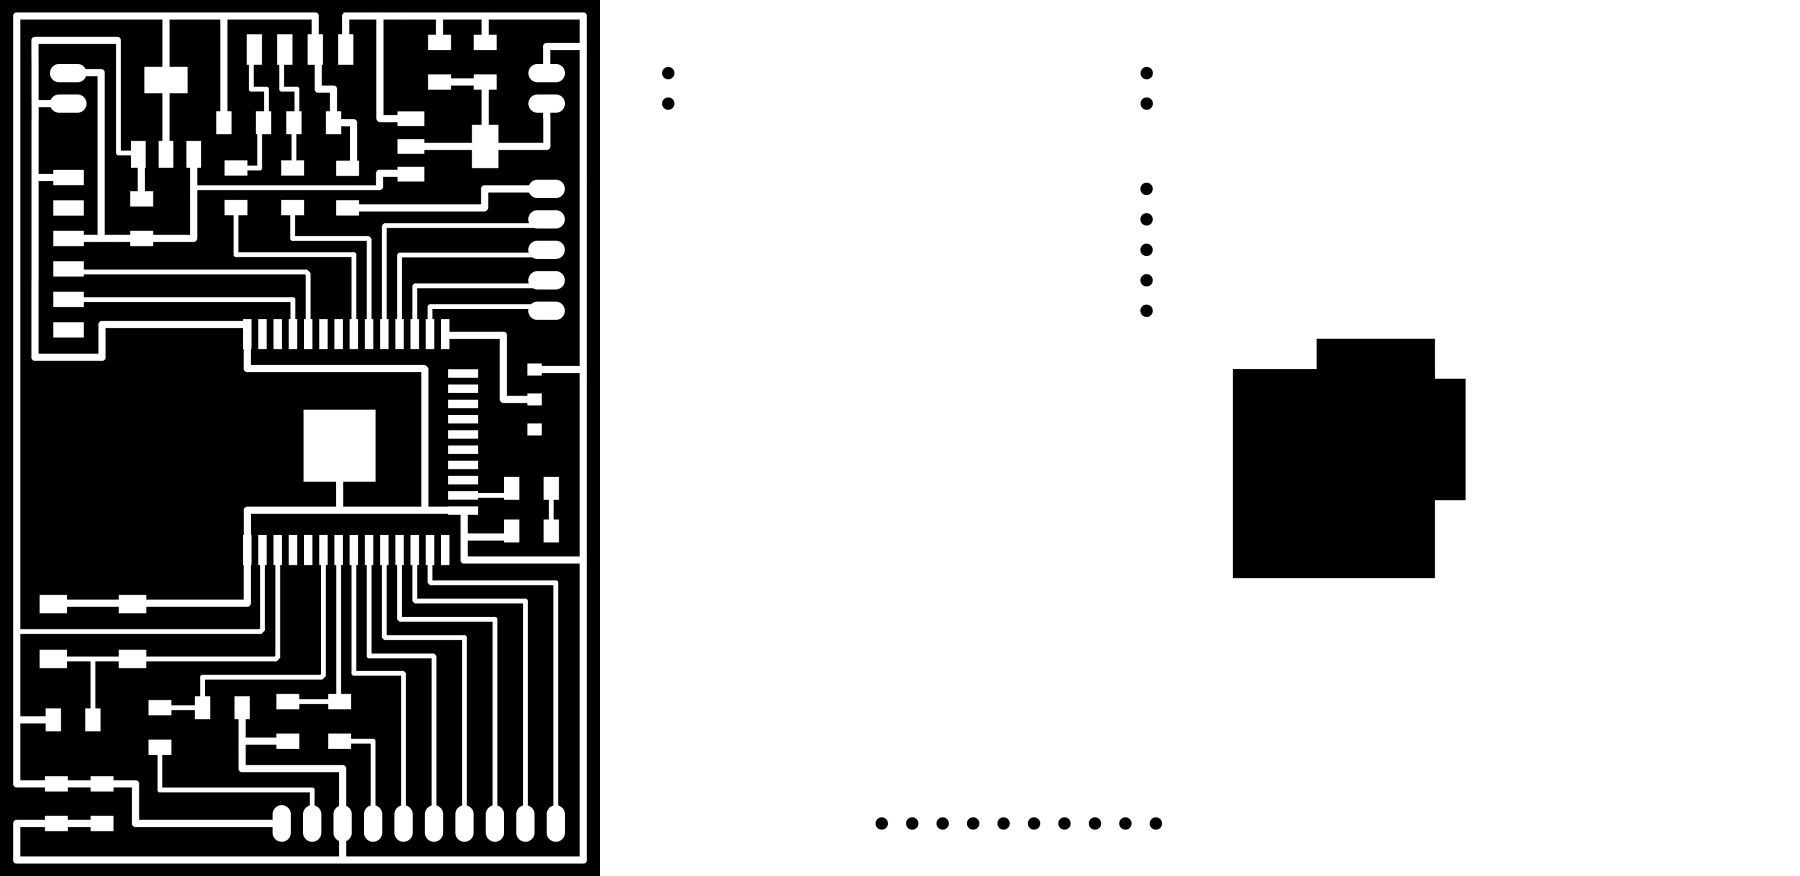
Below we have the KiCad schema and the PCB layout of the sensor shield:
And below we have the fancy 3D thing. I figured out that we can export the 3D PCB layout to .step, and then continue to work on it with CAD software (Blender or Fusion 360). We also can export the layout to a .fbx model which includes all textures and materials. That is cool!
I didn't notice a small problem here with the toolpath: some of the DHT11 traces were too close to each other. This actually led to a little accidental overheating which will be described below.
Milling and soldering the boards
Not much to say about the milling and soldering process:
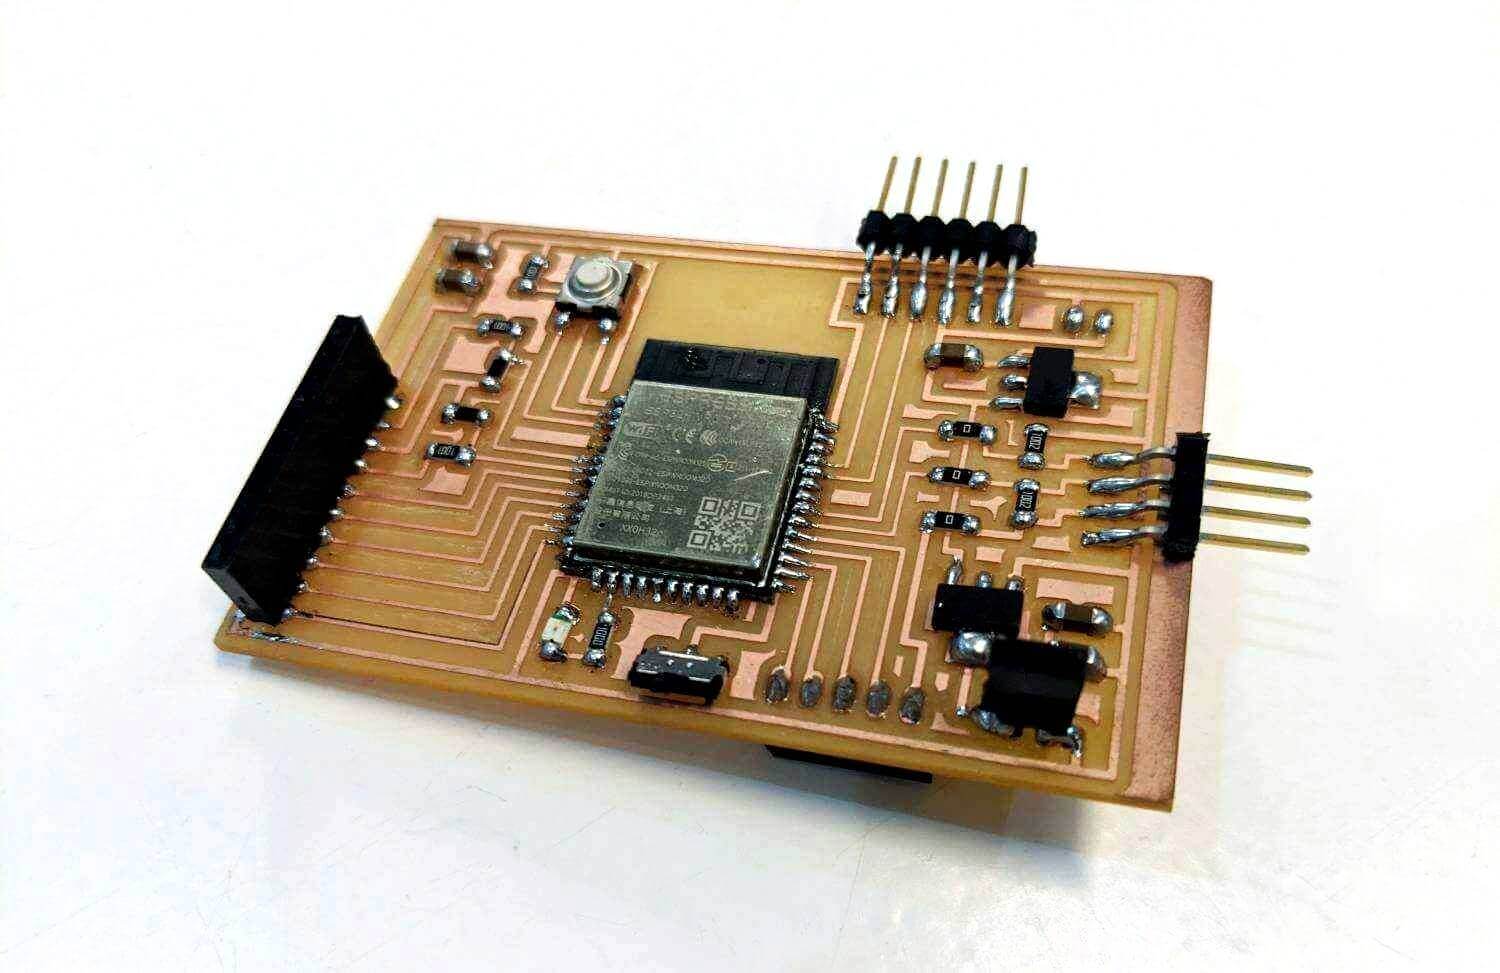
Then I had a problem trying to power the PCBs. The 3.3V voltage regulator was overheated too fast when I plugged the sensor shield onto the ESP32 board, and the temperature was too high that I couldn't even touch it. After checking again the ESP32 board with the help from our instructor Josep, we figured out that GND and 3.3V were connected right under the DHT11. This was a bad mistake for not carefully checking the milled board with the multimeter. To fix that, we used a knife to separate the traces.
Programming the board and reading sensors
Finally, they worked totally fine!
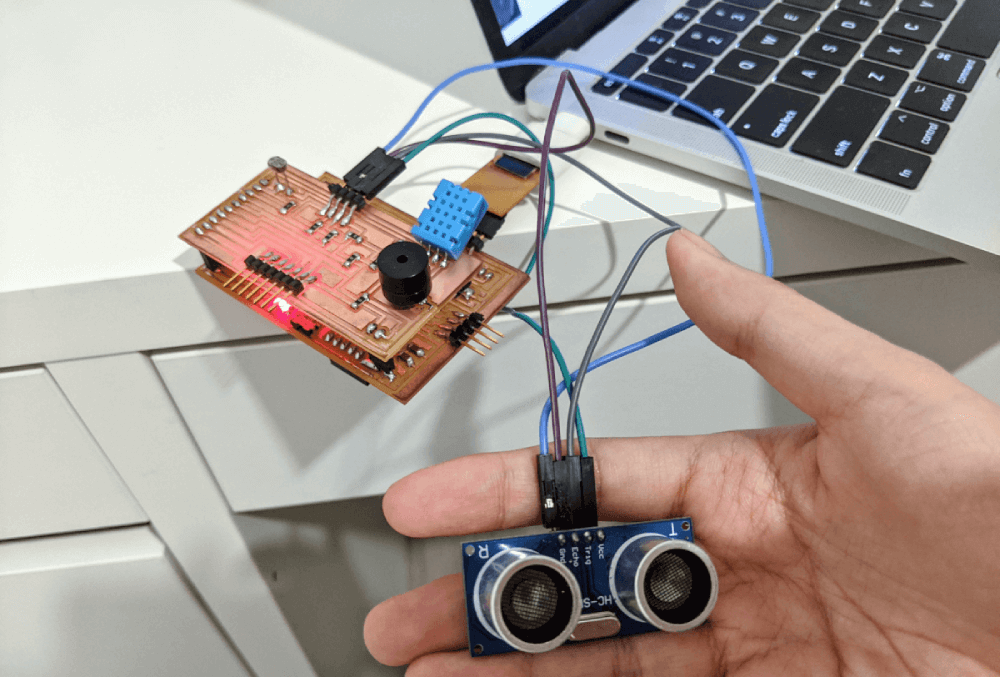
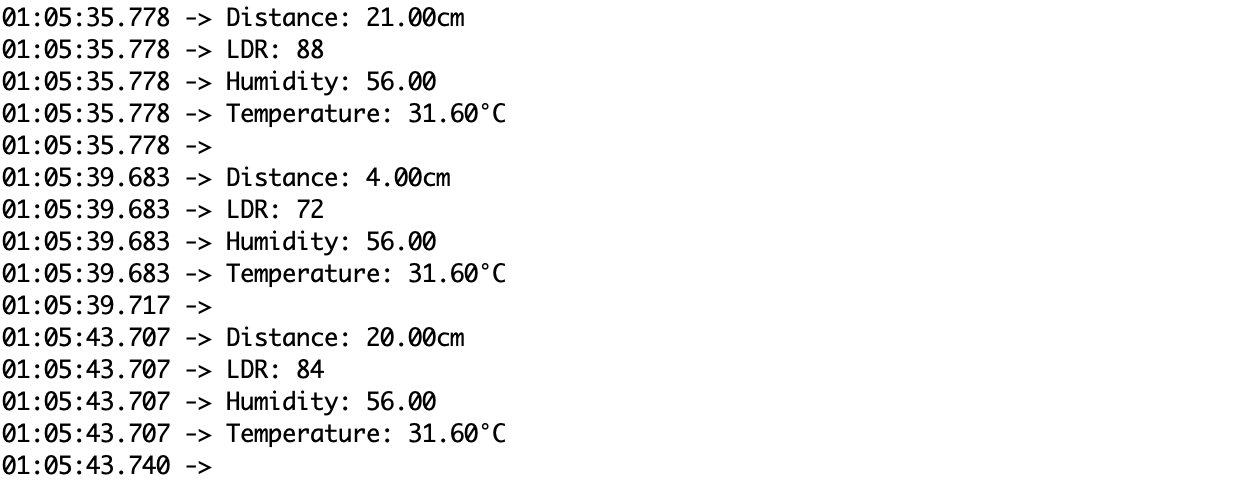
I used the NewPing library for reading the ultrasonic sensor by creating a sonar object. Below is the working code:
    #include <DHT.h>
    #include <NewPing.h>
    #define BUILTIN_LED 13
    #define TRIGGER_PIN 32
    #define ECHO_PIN 35
    #define DHT_PIN 33
    #define LDR_PIN 34

    /*
     * variables
     */
    int ldrValue;
    float tempValue;
    float humValue;
    unsigned int uS;
    float distance;

    /*
     * NewPing and DHT libraries
     */
    NewPing sonar(TRIGGER_PIN, ECHO_PIN, 200);
    #define DHTTYPE DHT11
    DHT dht(DHT_PIN, DHTTYPE);

    void setup() {
        pinMode(BUILTIN_LED, OUTPUT);
        Serial.begin(115200);
        dht.begin();
    }

    void loop() {
        delay(2000);
        ldrValue = analogRead(LDR_PIN);
        humValue = dht.readHumidity();
        tempValue = dht.readTemperature();
        uS = sonar.ping();
        distance = uS / US_ROUNDTRIP_CM;

        /*
         * print data
         */
        Serial.print("Distance: ");
        Serial.print(distance);
        Serial.print("cm");
        Serial.print(" \n");
        Serial.print("LDR: ");
        Serial.print(ldrValue);
        Serial.print(" \n");
        Serial.print(F("Humidity: "));
        Serial.print(humValue);
        Serial.print(" \n");
        Serial.print(F("Temperature: "));
        Serial.print(tempValue);
        Serial.print("°C");
        Serial.println(" \n");

        /*
         * debugging
         */
        digitalWrite(BUILTIN_LED, LOW);
        delay(1000);
        digitalWrite(BUILTIN_LED, HIGH);
        delay(1000);
    }
Conclusion
It was really fun playing around with these lovely sensors. Our instructor Oscar gave us an interesting class about digital signal processing, and I'd love to try them out in the upcoming assignments in order to take a more rigid and mathematical approach on processing and visualizing data.