10. Input devices

The corona crisis finally hit us last week, and we’ve been locked out of the university. Just before that happened, though, our instructors provided us with a take-home kit so we could while away the quarantine coming up with cool Arduino tricks…
A machine is nothing without sensors. This week’s work is all about incorporating them into our designs.
Input Devices with an Arduino
Since we’re not yet back in the shop, I continued with the Arduino, trying different sensors and programming languages as I went.
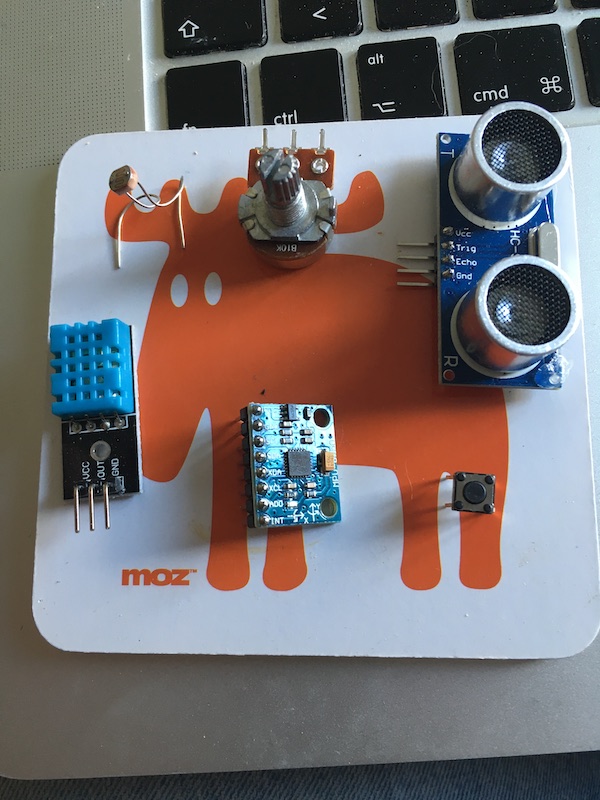
Corona kit contents
For reference, the take-home kit contained the following elements:
- Arduino Uno
- Pushbutton switches
- LEDs (yellow & red)
- Voltage regulator
- Light sensor
- Liquid crystal display (Lumex LCM-S01602DTR/M)
- Ultrasonic Distance Sensor (Joy-It HC-SR04)
- Miniature loudspeaker (CUI Devices GC0351N)
- Servo Motor (Hobby King HKSCM9-6)
- Servo Motor (Tower Pro SG90)
- Servo wire color code according to Pololu: brown = ground, red = power, orange = signal
- Accelerometer MPU-6050
I’ll go through them each in turn, and think of something interesting to do with the signals they generate.
Reading a “Switch”
A quick modification of the code is all that’s required to get the Arduino to read a switch. My “switch” was a jumper wire connected to pin 12 whose open end I held between two other jumpers connected to GND and VCC on the Arduino board.
int LEDpin = 13;
int buttonPin = 12;

void setup() {
    // set pins to output/input
    pinMode(LEDpin, OUTPUT);
    pinMode(buttonPin, INPUT);
}

void loop() {
pressed = digitalRead(butPin);
if (pressed == HIGH) {
  digitalWrite(ledPin, HIGH);
  } else {
  digitalWrite(ledPin, LOW);
  }
}
The Arduino sketch can be downloaded here.
The video below shows the system in operation. Note when the “switch” is in the neutral position, travelling between the two “contacts” (jumper wire ends), pin 12 is in an undefined state. As long as the switch action is definite and quick, the LED doesn’t bounce.
Pushbutton
To solve the undefined state problem, use a 1kΩ pull-up resistor. This ties the output of the pushbutton to the upper rail (VCC) when the switch is open, and then when the button is pressed and connection is made to ground, current flows through the resistor and the state of the pushbutton output is taken to the lower rail (ground). I didn’t have a resistor to hand, but there is one built into the ATMega chip. To use it, I added some code to the setup function in the sketch, as shown below:
// an example sketch to use the internal pull-up resistor in the ATMega

int buttonPin = 10;

void setup() {
  pinMode(buttonPin, INPUT);
  digitalWrite(buttonPin, HIGH); // gives the pin a default logic value HIGH
  pinMode(13,OUTPUT);
}

void loop() {
  if(digitalRead(buttonPin)) {
    digitalWrite(13,HIGH);
  } else {
    digitalWrite(13,LOW);
  }
}
The Arduino sketch can be downloaded here.
And some first success:
Potentiometer
To read a variable resistor, we use one of the analog-to-digital converters built into the Arduino Uno. The sketch looks like this:
void setup()
{
  // start serial port at 9600 bps:
  Serial.begin(9600);
}

void loop() {
  // read analog input, divide by 4 to make the range 0-255:
  int analogValue = analogRead(0)/4;
  Serial.write(analogValue);
  // pause for 10 milliseconds:
  delay(10);
}
The Arduino sketch may be downloaded here
The setup procedure just starts communication with the computer. In the loop, the analog voltage at Arduino port A0 is read continuously, divided by 4 so that the 1024 possible values on the ADC fit in the 256 possible values of a byte, and the value is written via serial to the computer. Here’s a video of it working.
Ultrasound Proximity Sensor
The ultrasound device, HC-SR04, has four pins: VCC, GND, Trigger and Echo. These are wired to the Arduino as shown below:
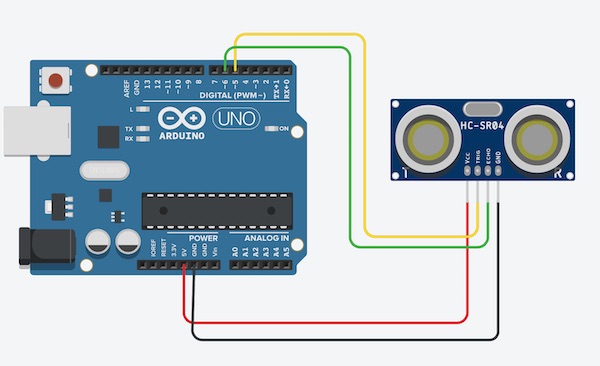
The code required to run the sensor is straightforward. The sensor requires a start signal, which is 2 μs of LOW followed by 10 μs of HI on the trigger pin. I then used the pulseIn() function to read the echo pin and produce a duration value for the time of echo. this was then converted into a distance by dividing the duration in two (out and back) and multiplying by the speed of sound in air, namely 340 m/s, and converting to centimeters. The Arduino sketch looks like this:
#define echo 6
#define sOfS 340
long duration = -1;
float distance = -1;

void setup() {
  // put your setup code here, to run once:
  pinMode(trig,OUTPUT);
  pinMode(echo,INPUT);
  Serial.begin(9600);
}

void loop() {
  // put your main code here, to run repeatedly:

  digitalWrite(trig,LOW);
  delayMicroseconds(2);
  digitalWrite(trig,HIGH);
  delayMicroseconds(10);

  duration = pulseIn(echo, HIGH);
  distance = (float(duration) / 2) * sOfS / 1e4;

  Serial.print("Duration:\t");
  Serial.print(duration);
  Serial.print("\t");
  Serial.print("Distance:\t");
  Serial.print(distance);
  Serial.print("\n");
}
The Arduino sketch is available for download here.
The end result
Multi-Axis Accelerometer
The device we’re working with is the MPU 6050, which is a 6-axis IMU sensor which is equipped with three accelerometers and a gyroscope. Outputs are linear acceleration in the three spatial directions, and rotational acceleration in the three rotational directions around the device’s centre of mass (or at least I think that’s what it’s providing).
The interface to the chip is done through the I2C protocol. I’ll see what the means later. First, though, I wired it up according to some instructions on marker.pro.
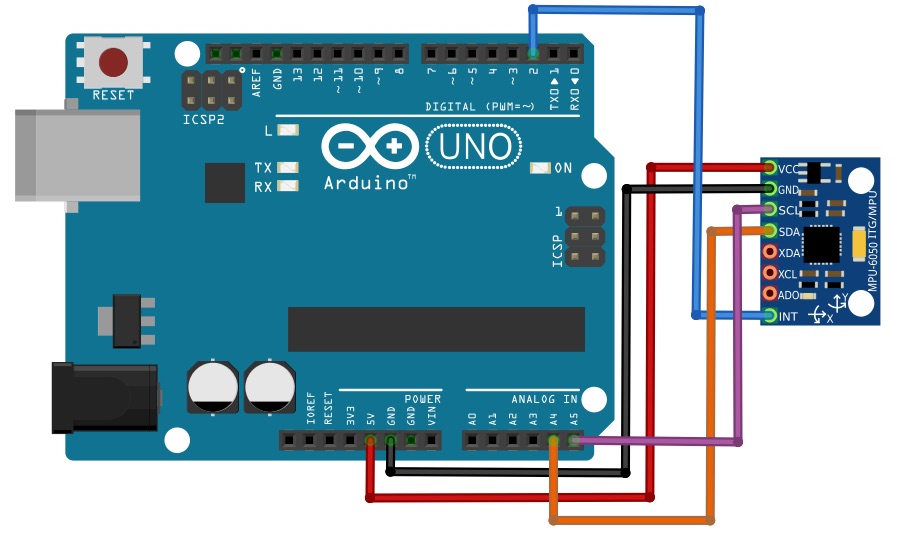
These are the pins on the MPU 6050, what they do, and where to wire them.
- VCC (power +) -> VCC
- GND (power -) -> VCC
- SCL (Serial Clock) -> A5
- SDA (Serial Data) -> A4
- XDA (Auxiliary Serial Data)
- XCL (Auxiliary Serial Clock)
- ADO (I2C Address Select)
- INT (Interrupt) -> Pin 2
The XDA, XCL and ADO pins are used when multiple IMU’s are connected together, so for the moment, I’ll not connect them to anything. The focus is first on the serial connection to the single device!
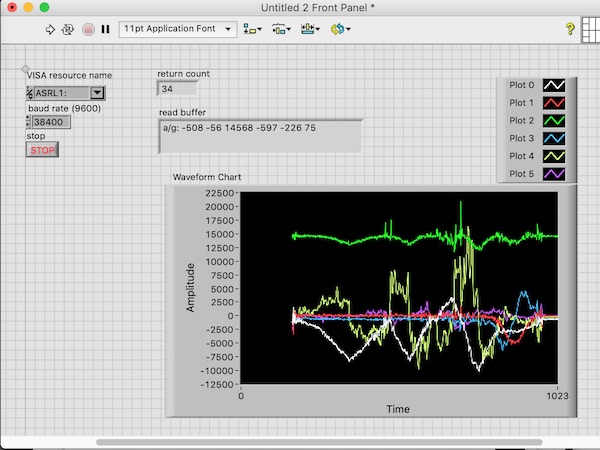
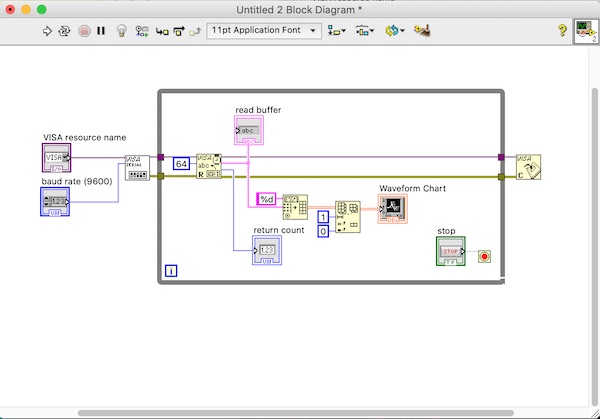
The easy way to do this is just to use a library. I found one at i2cdevlib.com which I downloaded. I then had to extract the two relevant libraries, namely i2cdevlib and mpu6050. Next I put those into my Arduino library using the usual Sketch:Include Library:Add .Zip Library menu. The library included an example (see below), which was quick to open and compile. I wrote a short bit of LabVIEW code to visualise the data, and here’s the result:
// I2C device class (I2Cdev) demonstration Arduino sketch for MPU6050 class
// 10/7/2011 by Jeff Rowberg <jeff@rowberg.net>
// Updates should (hopefully) always be available at https://github.com/jrowberg/i2cdevlib
//
// Changelog:
//      2013-05-08 - added multiple output formats
//                 - added seamless Fastwire support
//      2011-10-07 - initial release

/* ============================================
I2Cdev device library code is placed under the MIT license
Copyright (c) 2011 Jeff Rowberg

Permission is hereby granted, free of charge, to any person obtaining a copy of this software and associated documentation files (the "Software"), to deal in the Software without restriction, including without limitation the rights to use, copy, modify, merge, publish, distribute, sublicense, and/or sell copies of the Software, and to permit persons to whom the Software is furnished to do so, subject to the following conditions:

The above copyright notice and this permission notice shall be included in all copies or substantial portions of the Software.

THE SOFTWARE IS PROVIDED "AS IS", WITHOUT WARRANTY OF ANY KIND, EXPRESS OR IMPLIED, INCLUDING BUT NOT LIMITED TO THE WARRANTIES OF MERCHANTABILITY, FITNESS FOR A PARTICULAR PURPOSE AND NONINFRINGEMENT. IN NO EVENT SHALL THE AUTHORS OR COPYRIGHT HOLDERS BE LIABLE FOR ANY CLAIM, DAMAGES OR OTHER LIABILITY, WHETHER IN AN ACTION OF CONTRACT, TORT OR OTHERWISE, ARISING FROM, OUT OF OR IN CONNECTION WITH THE SOFTWARE OR THE USE OR OTHER DEALINGS IN THE SOFTWARE.
===============================================
*/

// I2Cdev and MPU6050 must be installed as libraries, or else the .cpp/.h files
// for both classes must be in the include path of your project
#include "I2Cdev.h"
#include "MPU6050.h"

// Arduino Wire library is required if I2Cdev I2CDEV_ARDUINO_WIRE implementation
// is used in I2Cdev.h
#if I2CDEV_IMPLEMENTATION == I2CDEV_ARDUINO_WIRE
    #include "Wire.h"
#endif

// class default I2C address is 0x68
// specific I2C addresses may be passed as a parameter here
// AD0 low = 0x68 (default for InvenSense evaluation board)
// AD0 high = 0x69
MPU6050 accelgyro;
//MPU6050 accelgyro(0x69); // <-- use for AD0 high

int16_t ax, ay, az;
int16_t gx, gy, gz;


// uncomment "OUTPUT_READABLE_ACCELGYRO" if you want to see a tab-separated
// list of the accel X/Y/Z and then gyro X/Y/Z values in decimal. Easy to read,
// not so easy to parse, and slow(er) over UART.
#define OUTPUT_READABLE_ACCELGYRO

// uncomment "OUTPUT_BINARY_ACCELGYRO" to send all 6 axes of data as 16-bit
// binary, one right after the other. This is very fast (as fast as possible
// without compression or data loss), and easy to parse, but impossible to read
// for a human.
//#define OUTPUT_BINARY_ACCELGYRO


#define LED_PIN 13
bool blinkState = false;

void setup() {
    // join I2C bus (I2Cdev library doesn't do this automatically)
    #if I2CDEV_IMPLEMENTATION == I2CDEV_ARDUINO_WIRE
        Wire.begin();
    #elif I2CDEV_IMPLEMENTATION == I2CDEV_BUILTIN_FASTWIRE
        Fastwire::setup(400, true);
    #endif

    // initialize serial communication
    // (38400 chosen because it works as well at 8MHz as it does at 16MHz, but
    // it's really up to you depending on your project)
    Serial.begin(38400);

    // initialize device
    Serial.println("Initializing I2C devices...");
    accelgyro.initialize();

    // verify connection
    Serial.println("Testing device connections...");
    Serial.println(accelgyro.testConnection() ? "MPU6050 connection successful" : "MPU6050 connection failed");

    // use the code below to change accel/gyro offset values

    Serial.println("Updating internal sensor offsets...");
    // -1600    -2359   1688    0   0   0
    Serial.print(accelgyro.getXAccelOffset()); Serial.print("\t"); // -1600
    Serial.print(accelgyro.getYAccelOffset()); Serial.print("\t"); // 300
    Serial.print(accelgyro.getZAccelOffset()); Serial.print("\t"); // -14500
    Serial.print(accelgyro.getXGyroOffset()); Serial.print("\t"); // 0
    Serial.print(accelgyro.getYGyroOffset()); Serial.print("\t"); // 0
    Serial.print(accelgyro.getZGyroOffset()); Serial.print("\t"); // 0
    Serial.print("\n");
    accelgyro.setXAccelOffset(-1480);
    accelgyro.setYAccelOffset(-3910);
    accelgyro.setXGyroOffset(0);
    accelgyro.setYGyroOffset(0);
    accelgyro.setZGyroOffset(0);
    Serial.print(accelgyro.getXAccelOffset()); Serial.print("\t"); // -1600
    Serial.print(accelgyro.getYAccelOffset()); Serial.print("\t"); // 300
    Serial.print(accelgyro.getZAccelOffset()); Serial.print("\t"); // -14500
    Serial.print(accelgyro.getXGyroOffset()); Serial.print("\t"); // 0
    Serial.print(accelgyro.getYGyroOffset()); Serial.print("\t"); // 0
    Serial.print(accelgyro.getZGyroOffset()); Serial.print("\t"); // 0
    Serial.print("\n");


    // configure Arduino LED pin for output
    pinMode(LED_PIN, OUTPUT);
}

void loop() {
    // read raw accel/gyro measurements from device
    accelgyro.getMotion6(&ax, &ay, &az, &gx, &gy, &gz);

    // these methods (and a few others) are also available
    //accelgyro.getAcceleration(&ax, &ay, &az);
    //accelgyro.getRotation(&gx, &gy, &gz);

    #ifdef OUTPUT_READABLE_ACCELGYRO
        // display tab-separated accel/gyro x/y/z values
        Serial.print("a/g:\t");
        Serial.print(ax); Serial.print("\t");
        Serial.print(ay); Serial.print("\t");
        Serial.print(az); Serial.print("\t");
        Serial.print(gx); Serial.print("\t");
        Serial.print(gy); Serial.print("\t");
        Serial.println(gz);
    #endif

    #ifdef OUTPUT_BINARY_ACCELGYRO
        Serial.write((uint8_t)(ax >> 8)); Serial.write((uint8_t)(ax & 0xFF));
        Serial.write((uint8_t)(ay >> 8)); Serial.write((uint8_t)(ay & 0xFF));
        Serial.write((uint8_t)(az >> 8)); Serial.write((uint8_t)(az & 0xFF));
        Serial.write((uint8_t)(gx >> 8)); Serial.write((uint8_t)(gx & 0xFF));
        Serial.write((uint8_t)(gy >> 8)); Serial.write((uint8_t)(gy & 0xFF));
        Serial.write((uint8_t)(gz >> 8)); Serial.write((uint8_t)(gz & 0xFF));
    #endif

    // blink LED to indicate activity
    blinkState = !blinkState;
    digitalWrite(LED_PIN, blinkState);
}
Sensors Box
This just came in the mail.
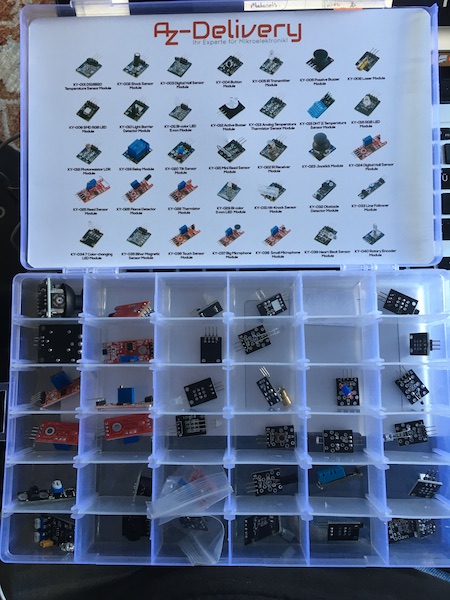
Now there’s a whole lot more fun to explore!
A Heartrate Monitor
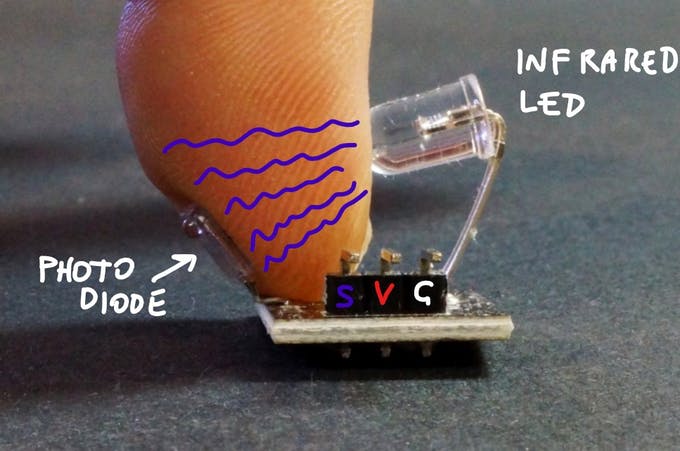
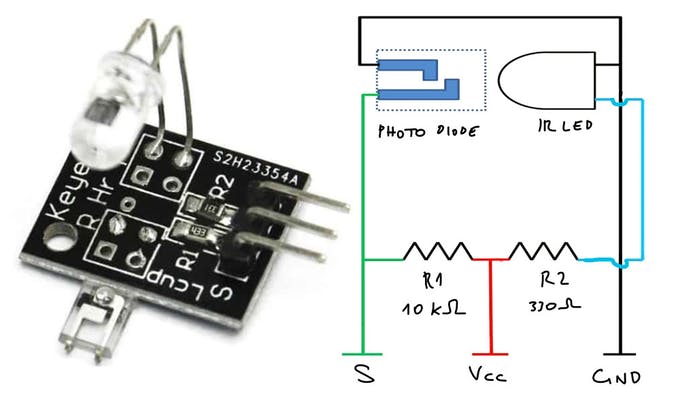
The sensor box came with a ‘heart beat sensor module’ which consists of an infrared LED and a photodiode. Placing a finger between the two results in a voltage signal which is proportional to the quantity of blood present in the capillaries of the fingertip. Sampling that signal and converting it into a heartbeat is straightforward, but does require a bit of doing.
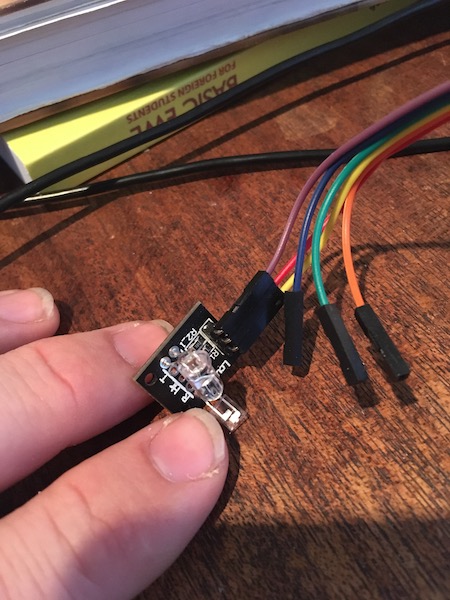
The sensor is quickly wired to the Arduino. The pinout, seen from the top as in the picture, is GND (purple), +3.3V (red), Signal (yellow). The signal pin was connected to pin A0 on the Arduino. Here’s a handy graphic from Giulio Pons’ website for future connection reference.
The code to read the signal was modified from Johan Ha‘s excellent tutorial. He did some nice fancy footwork with pointers and arrays to make his code more compact. I chose instead to stick to multiple for loops to keep mine more understandable. The required sampling rate was not so high that the ATMega328 couldn’t keep up, even with my inefficient code, shown in the pix below.
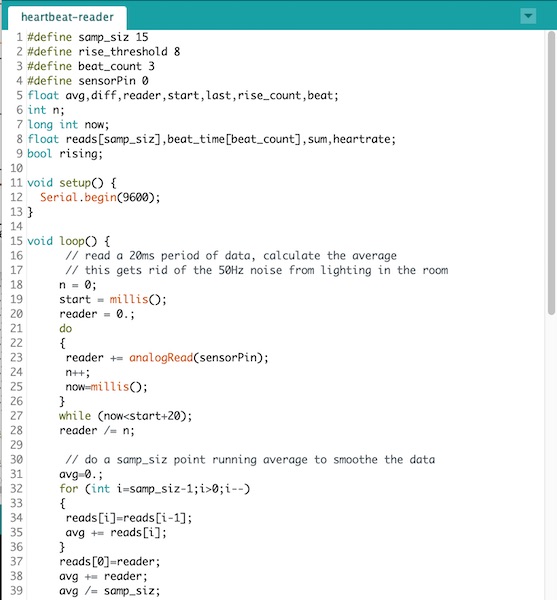
There are four parts to the code. In the first section, 20ms of data is collected from the sensor (using a “do-while” loop) and averaged. This is a simple trick to overcome the 50Hz electric noise in the room, which is driven by the mains electricity. In North America, the equivalent trick to overcome the 60Hz noise would be to sample 16.67ms at a time.
The second section does a 15-point running average over the data to smoothe out the sampling noise. The data is stored in a 15-element array called “reads” and shifted along through the array by the for loop with every iteration of the loop() procedure. The oldest data is overwritten in the last element of the array.
The third section is the heartbeat detector. Here the strategy is to identify a rising slope in the data which continues for more than 8 samples. Whenever this happens the millisecond time of the event is saved into an array.
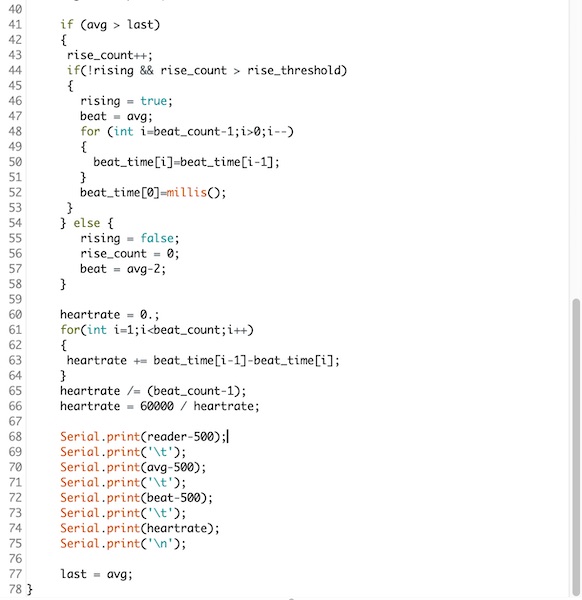
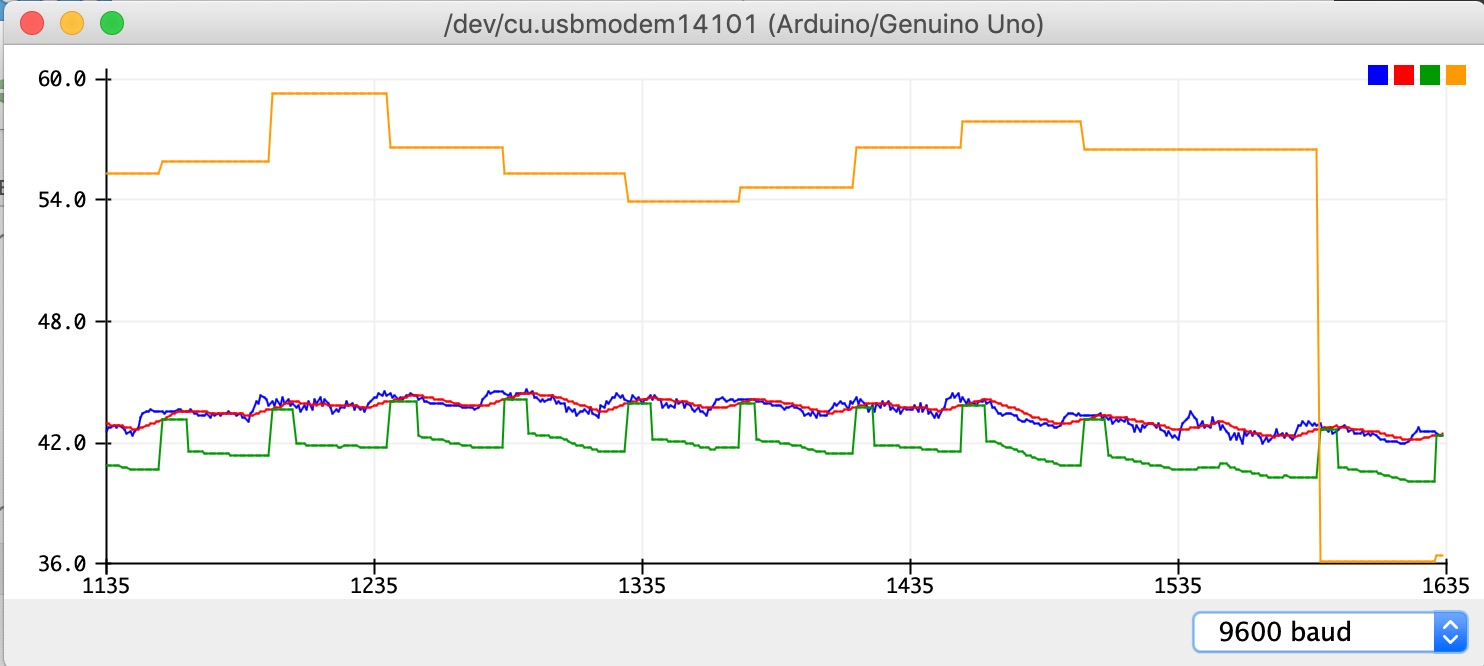
In the fourth section, the heartrate is calculated based on an average of the last few beats, and all is displayed so that the Arduino Serial Plotter can show the result.
The Arduino sketch is available here
Oximeter
The KY-039 sensor (described above) can be modified to make a blood oygen meter. There is an excellent page by Giulio Pons, which describes the steps necessary to do the conversion and then read the signals to measure heart rate and infer blood oxygen. The basic trick is to add a second LED to the sensor board, then control them individually while readying from the same phototransistor. The difference in the transmissivity at the two wavelengths provides the signal which can be used to measure the blood oxygen level.
Modifying the sensor
The modification of the sensor board is straightforward. The board comes with an infrared LED already mounted. The circuit diagram of the sensor board is shown below:
The first step is to remove the 330Ω resistor. It is not needed and its removal breaks the net indicated in cyan in the figure above. Then the two LEDs are connected in parallel to GND, and each is connected via a resistor to the digital output pins of the microcontroller. The final circuit diagram and modified board look like this:
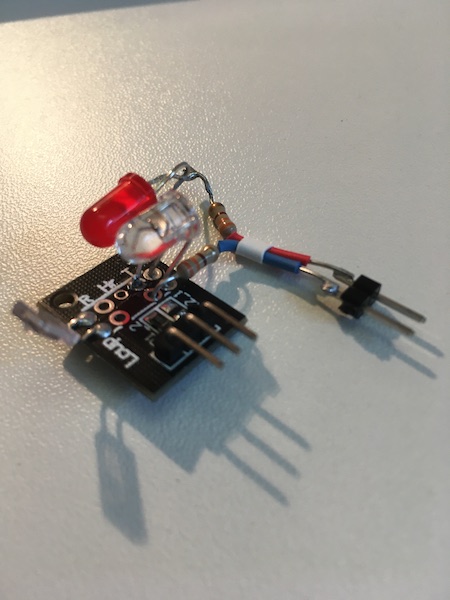
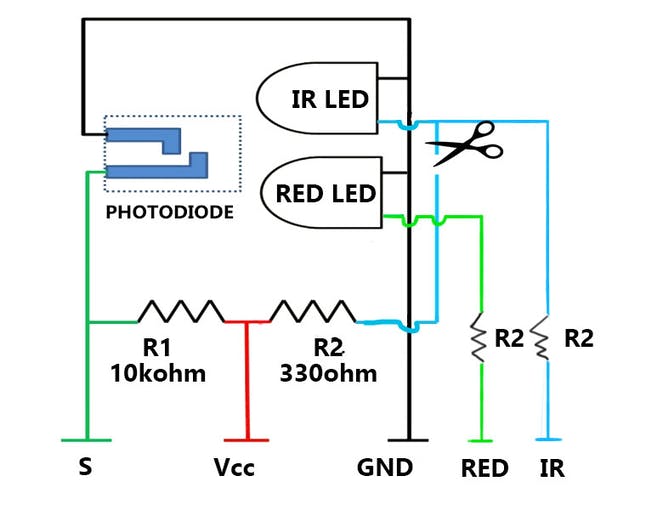
The blue insulated line is to the IR LED while the red insulated line is to the normal red LED. There is a 330Ω resistor in series with each. There is a second set of vias in the KY-039 board. One of the open holes was connected to the GND net, so I soldered the negative side of the red diode there. The other open hole was connected to the positive side of the IR diode (and to the missing 330Ω resistor I removed earlier), so I soldered the new resistor there.
Connecting to a Nano
The first test of the sensor involved using an Arduino Nano I had lying around. The modified KY-039 board was readily connected to Vcc and GND, with its sensor pin led to A1 of the Nano and the two LEDs to pins D8 (IR) and D9 (Red).
Connecting the Nano to the LCD Screen
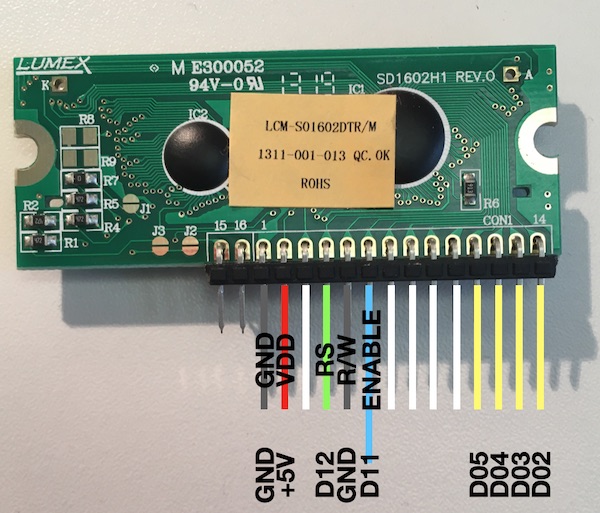
Additionally the Nano was connected to an LCD unit (described in Week 12) so that I could read the output. The connections are all described in Week 12, with the one modification that instead of using a 10k potentiometer to power the liquid crystal, I used a voltage divider with 1,8k / 8.2k ratio. There’s a useful picture in Week 12 which I’ll reproduce here for reference:
The Code
Though the code draws heavily on Giulio Pons’ original effort, and he is certainly owed the credit for both the idea and the problem solving, I’ve made enough modifications that I’d better describe what I’ve done.
The header part of the code does the usual set up of the variables. In this case the important elements are the pin assignments for the sensor and the LCD, followed by the data arrays readsIR/readsRed and beatIR/beatRed. The “reads” arrays hold the signals during the “off” beats, while the code is not measuring anything, and the “beat” arrays record the data during an actively monitored heart beat.
Next I’ve defined three functions. One is just to gather the serial communications with the computer into one place. The next reads the photo transistor in 20ms to 40ms chunks to smoothe out the electrical noise. The third function does a four point moving average back from the current position in the array, as part of the algorithm that detects the beginning of a beat.
The setup function does all of the usual things, setting up the interface with the LCD and the serial communication with the computer. It also flashes a welcome on the LEDs and finally collects a short bit of phototransistor data to use as a zero for the IR trace later.
In the main program, the first part turns on the LEDs in turn and collects the data. The four point average is then performed on the IR data.
A compound if statement that checks if the voltage is rising relative to the average, and if so sets flags which indicate that a beat is in progress. A quick pair of millis() calls also measures the time from start to end of the active beat.
The next if statement stores the transistor signal in a separate pair of arrays (though strictly speaking this isn’t completely necessary) and then finds the max and min of both, in order to calculate “R”, which then fits into a calibration equation to determine the oxygen saturation. The coefficients of the calibration are obtained by comparing the “R” output of this device with the SpO2 output of a commercial device during a breath-hold exercise. Giulio Pons provides the details on his arduino project page.
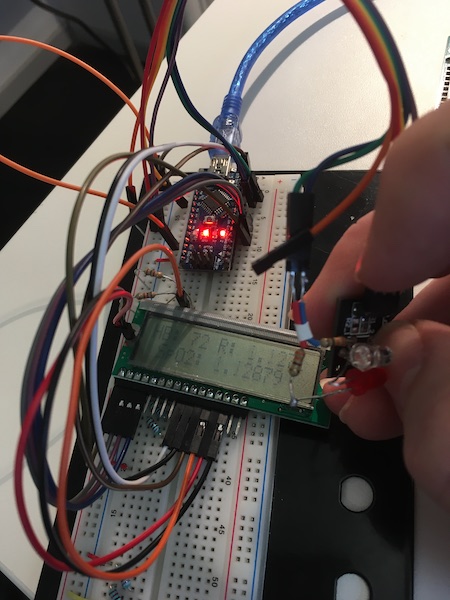
The functioning machine is shown below:
The Arduino sketches are here:
Using the Bird Board
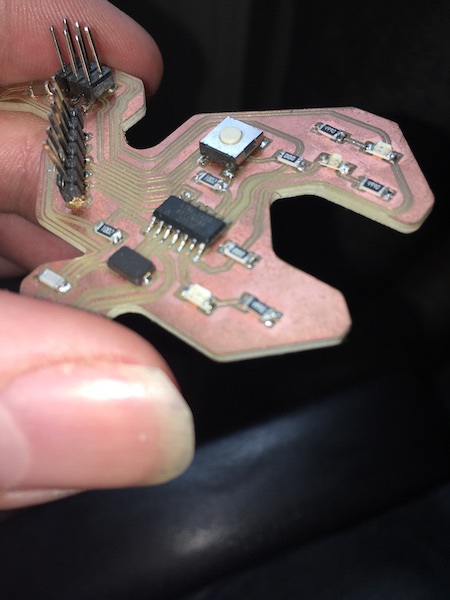
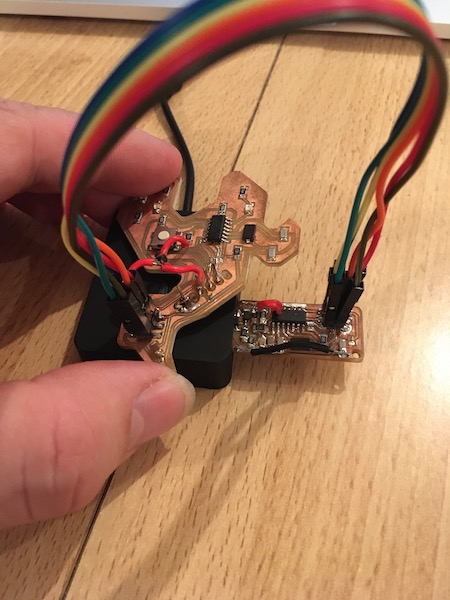
Once the quarantine was lifted and we could get back into the lab, I was able to recover the bird board I’d built for the Electronics Design assignment. I plugged it into the FabISP, and then plugged that into the Mac. The blue and yellow LEDs flashed to confirm the startup procedure, and then pressing the button caused the green LED to flash. So all was well.
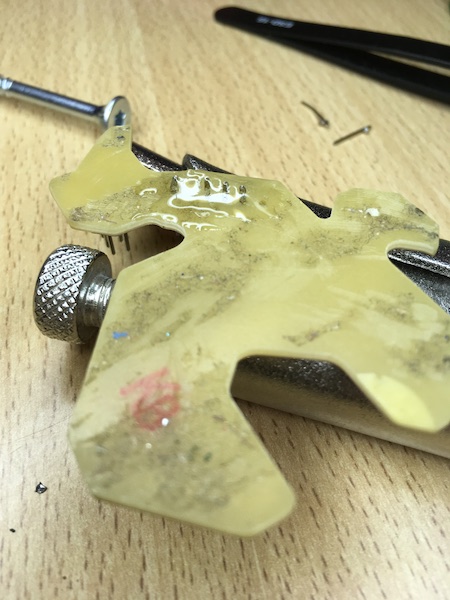
Repairs
The celebration didn’t last long, however. The through-board pins quickly came loose and the traces to them broke free of the board. I carefully but deliberately completed the break, cutting the traces so that they wouldn’t rip off the board any further. I then epoxied the header pins in place and switched into neurosurgeon mode.
My repairs started with a fairly large gauge insulated jumper wire for the Vcc, followed by a puddle of solder and a piece of the solder absorbing mesh to connect the GND pin to the ground layer. The TX and RX pins I repaired using strands taken from the twisted core of the ground wire of an old extension cable. I made loops in one end to slip over the header pins, then routed the wires toward the broken traces. After scraping and tinning both wire and trace, I soldered them together. It’s not the cleanest job there ever was, but it works.
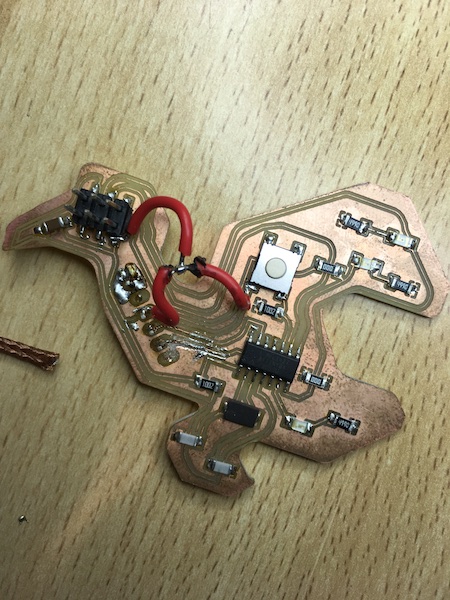
I scraped out the spaces between the traces to make sure there were no bridges, checked everything with the multimeter, and then powered up the board, again via the Ugly Duckling ISP and the USB hub. I’m happy to report that it all works again.
Programming
Now it’s time for programming. I modified the sketch I wrote to test the bird board in the previous example. This time, the blue (pin 7) and green (pin 5) LEDs will flash first to say the board is ready, and the button will activate the yellow (pin 6) one. Here is the new sketch:
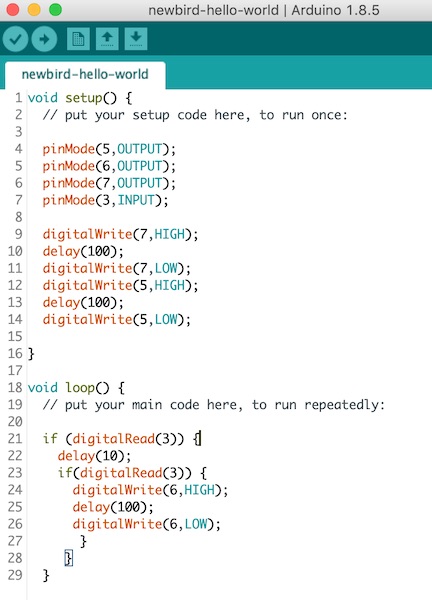
The arduino sketch is available here.
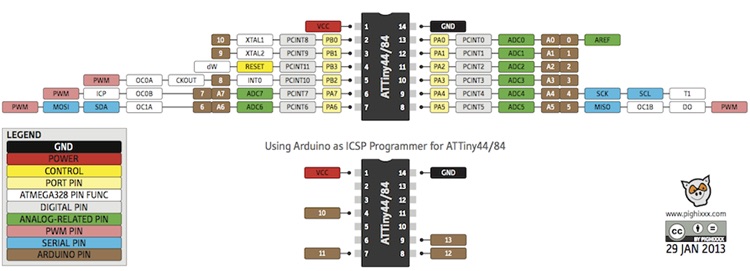
The next step was to connect the bird board to the FabISP. Although I had included the same 2x3 header on both boards, I didn’t trust myself, so I went back to the Eagle circuit diagrams to confirm the connections. On the left, the FabISP header pinout from Week 5, and on the right, the newbird pinout from Week 9.
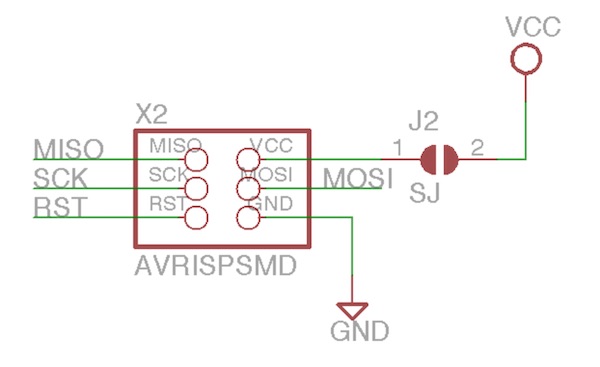
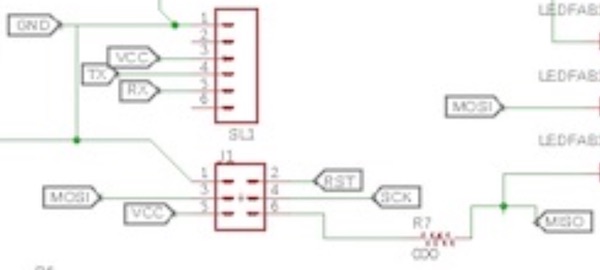
Connecting the pins carefully together, noting that the Vcc pin on the birdboard is at the caudal-ventral corner of the header in the bird frame of reference. The Vcc pin is in the top (away from the hole) right corner of the FabISP. The connections look like this:
Once the wires were connected, I plugged in the USB hub and watched the lights all blink appropriately. Then I set up the Arduino IDE tools menu as shown below:
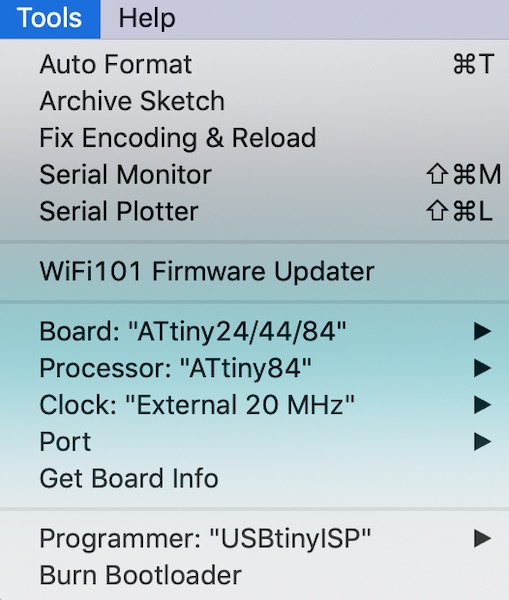
Note there is no “Port”, as the UglyDuckling FabISP is a native USB device, rather than a USB-Serial device like the Arduino Uno. All I had to do was launch the sketch in the usual way, and everything happened. The LEDs on the bird board flashed as the data transferred from the UglyDuckling over the MISO and MOSI lines, then the red text flowed over the Arduino IDE, finishing with those magic words, “avrdude done. Thank you.” The new code is loaded as can be seen at the end of the video below.
Input devices with BirdBoard
During the lockdown, I did most of this exercise with an Arduino. I’ll now set up a few sensors to work with my own board, which is good practice for the final project later, which will also make use of ATtiny84 microcontrollers.
Pushbutton
The BirdBoard includes an input device, namely a pushbutton switch in its design. The switch is hardwired between Vcc and pin 10 (PA3). A pull-down resistor is placed between the pin 10 and GND to ensure there is no indeterminate state when the pushbutton is open. Looking again at the Arduino sketch:
The Arduino IDE numbers the pins in its own way, as shown in brown in the diagram below:
In the setup procedure, the Arduino pins 5,6,7 (ATtiny pins 8,7,6) are set as output, and pin 3 (10) is set to input. A little light show is then played to confirm to the user that the device is on and ready to go. In the loop procedure, two consecutive calls are made to the digitalRead function - this is to deal with pushbutton “bounce” (essentially imperfections in the physical electrical connection inside the switch). By waiting 10msec after detecting a pushbutton event, the program hops over the noisiness of the contact. When the pushbutton event is confirmed to be real, then the LED on Pin 6 (8) is lit (in this case, the yellow one).
Potentiometer
The BirdBoard is equipped with a 1x6 header which was originally conceived as a serial connection. It has two pins (Arduino 0 & 1 or physical pins 13 & 12), Vcc and ground. To test the system, I placed a potentiometer between Vcc and GND, and connected the wiper to Pin 13 (Arduino 0). I then set up the Arduino code to read the voltage at A0 (Pin13) and turn on the LEDs in geometric sequence as the voltage increased from 0 to Vcc (from 0 to 1023 after the ADC conversion on A0). The sketch is shown below.
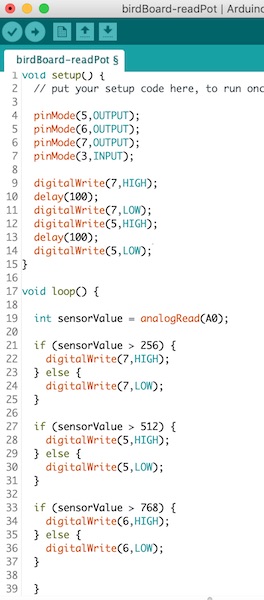
The Arduino sketch is available here.
That it works is shown in the following video.
Heart Rate
The bird board also made a relatively decent heart beat detector. I used the pin headers in its neck to connect the KY-039. Because it’s time there was a proper connection photograph of this little fellow:
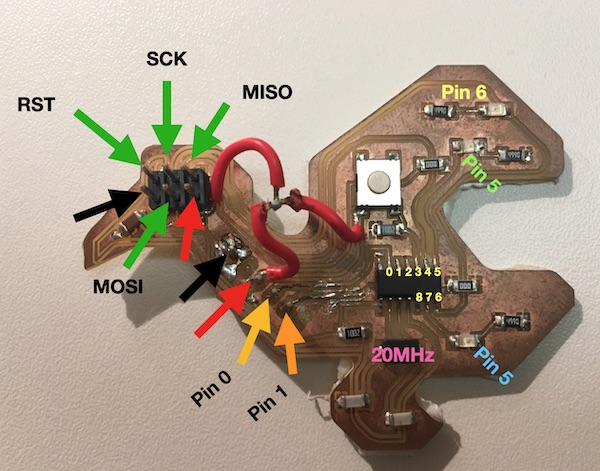
For the heart rate monitor, only one external LED is required, so the neck connector was sufficient. The IR LED was connected to Neck Pin 0 and the output of the phototransistor to Neck Pin 1.
The code had to be modified to fit with the available resources on the bird board. The first most obvious change was to the pin assignments. For the bird board these were:
| Name | Sketch Pin | Board Location |
|---|---|---|
| sensorPin | 1 | Neck Pin 1 |
| REDLed | 6 | yellow LED |
| IRLed | 0 | Neck Pin 0 |
| beatLed | 5 | green LED |
Then the serial communication had to be commented out, as there is no built in serial connectivity on the AtTiny84. For communication with the user, I relied instead on the LEDs. The heart beat was indicated by a flash of the green LED. I added an “if” statement to have it only flash if the calculated heart rate was between 40 and 80 bpm. This was to reduce the response of the code to noise when there was no finger present in the sensor.
Here’s a short movie of the system in operation. From the start, we see first the usual “upload light show”, followed by the three flashes from the yellow LED to “say hello”. Then the sensor is ready. When a finger is placed in the sensor and adjusted appropriately, the green LED begins to flash in a rhythmic pattern corresponding to my heart rate. When I remove my finger, the rhythmic pattern stops and the LED usually remains in the OFF state. Noise on the line sometimes triggers it for even a few flashes, but generally it remains off until the finger is reinserted.
The sketch is available for download here.
Group Assignment
Our group assignment for this week is described here