13. Interface and application programming
There are several goals this week. One is to get an external device (computer, phone, whatever) speaking with and controlling the embedded one. The second is to design a user interface of some kind. These projects are described below.
Interface 1: LabVIEW -> Arduino
I’ve been programming in LabVIEW, which is essentially a C++ compiler since the mid 1990s, so I thought I’d give it a try to see if I could control the Arduino using that system.
First step was to install the appropriate, modern, versions of LabView (2019) and NI-VISA (19.0) on my Mac running Mojave. With those working, I was able to run the example VIs in LabView and confirm they could recognise the Arduino on the ASRL::INSTR port. I’m not sure why it turned up there, but I’ll not complain too loudly, since it worked.
Serial communications
Second step was to establish serial communication with the Arduino. To do that, I used the Arduino IDE AnalogReadSerial example to read a potentiometer whose wiper was connected to analog input A0 and output the value over the serial connection. Here’s the sketch:
/*
  AnalogReadSerial
  http://www.arduino.cc/en/Tutorial/AnalogReadSerial
*/

void setup() {
  Serial.begin(9600); // initialise serial comms at 9600 baud
}

void loop() {
  // read the input on analog pin 0:
  int sensorValue = analogRead(A0);
  // print out the value you read:
  Serial.println(sensorValue);
  delay(1);        // delay in between reads for stability
}
The third step was to set up a serial communication VI in LabVIEW. I took inspiration from both www.instructables.com and the “Continuous Serial Read and Write” example VI provided by National Instruments. In the end, the fancy “Bytes on Port” part of the Instructables code didn’t work with the LabVIEW version I have. I deleted that part of their code, and it worked like a charm.
LabView UI
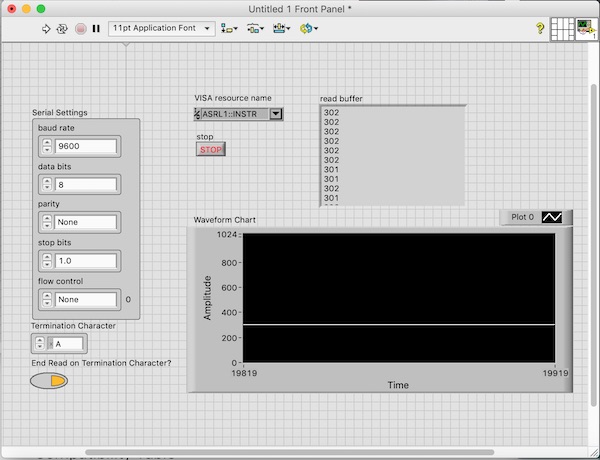
The front panel (user interface) is shown here:
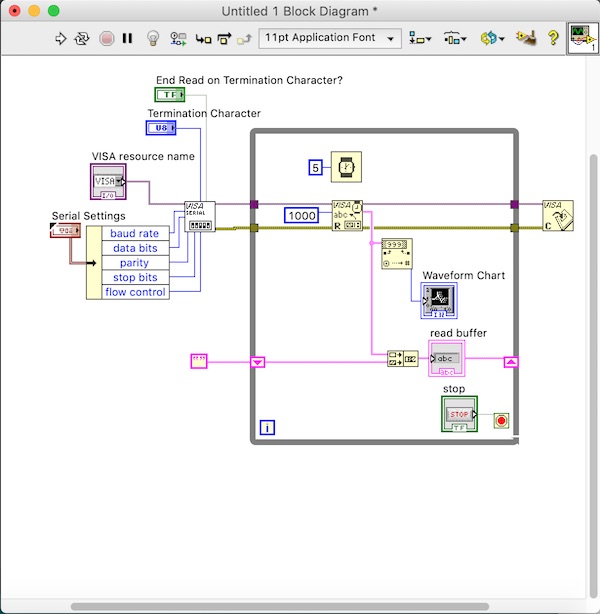
And the wiring diagram (code) is shown here:
The proof that it worked is shown in this short video:
Controlling Arduino with LabView.
National Instruments have published a set of Arduino libraries called LINX which apparently will do the trick. There is a set of compiled libraries available on github. After forking that and downloading the repository, I zipped the ArduinoUno directory and added it to the Arudino IDE libraries manager.
Installed two libraries - LinxArduinoUno and LinxSerialListener - then had to edit the .h and .cpp files in the latter to switch the backslash for a forward slash so that the compiler could find the include files in the utility folder. In the LINX:Arduino_Uno_Serial folder is an Arduino sketch which basically makes the Arduino into an ADC. The sketch is as follows:
/******************************************************************
**  This is example LINX firmware for use with the Arduino Uno
**   with the serial interface enabled.
**
**  For more information see:  www.labviewmakerhub.com/linx
**  For support visit the forums at:    www.labviewmakerhub.com/forums/linx
**
**  Written By Sam Kristoff
**
**  BSD2 License.
*******************************************************************/

//Include All Peripheral Libraries Used By LINX
#include <SPI.h>
#include <Wire.h>
#include <EEPROM.h>
#include <Servo.h>

//Include Device Specific Header From Sketch>>Import Library (In This Case LinxArduinoUno.h)
//Also Include Desired LINX Listener From Sketch>>Import Library (In This Case LinxSerialListener.h)
#include <LinxArduinoUno.h>
#include <LinxSerialListener.h>

//Create A Pointer To The LINX Device Object We Instantiate In Setup()
LinxArduinoUno* LinxDevice;

//Initialize LINX Device And Listener
void setup()
{
  //Instantiate The LINX Device
  LinxDevice = new LinxArduinoUno();

  //The LINXT Listener Is Pre Instantiated, Call Start And Pass A Pointer To The LINX Device And The UART Channel To Listen On
  LinxSerialConnection.Start(LinxDevice, 0);
}

void loop()
{
  //Listen For New Packets From LabVIEW
  LinxSerialConnection.CheckForCommands();

  //Your Code Here, But It will Slow Down The Connection With LabVIEW
}
Basically what this sketch is doing is listening for commands from the LabVIEW program on the other end of the USB connection, then sending the state of whatever variable is requested via the pointer.
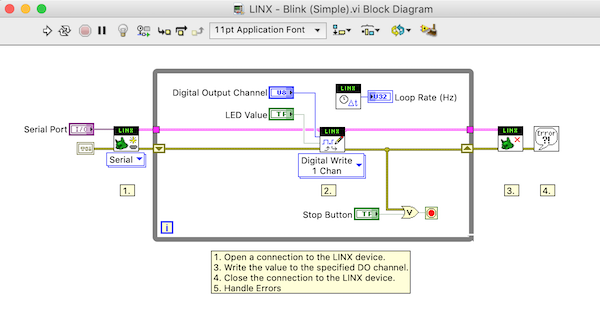
The LabVIEW code looks like this:
Flashing the LED
As described in the yellow comments box, the code starts by opening a connection and initalising the communication with the Arduino, then outputs a command via the “Digital Write 1 Chan” function inside the while loop, and repeats until the user hits the stop button, after which it closes the connection and cleans up.
The results are shown in the video below:
Stoked, again!
So what have I achieved? I now have an inexpensive, programmable, multichannel USB DAQ board, which may come in really quite useful later.
Interface 2: Arduino -> LabVIEW
In this section, the objective was to make a measurement on the microcontroller board and use that to control the user interface on the computer. Here I used the Arduino to make a measurement which I sent to the LabVIEW UI.
Light Sensor
The light sensor is essentially a light-sensitive resistor. A quick test in the daytime “home office” (living room) lighting conditions showed it to vary between 10kΩ and 100kΩ:
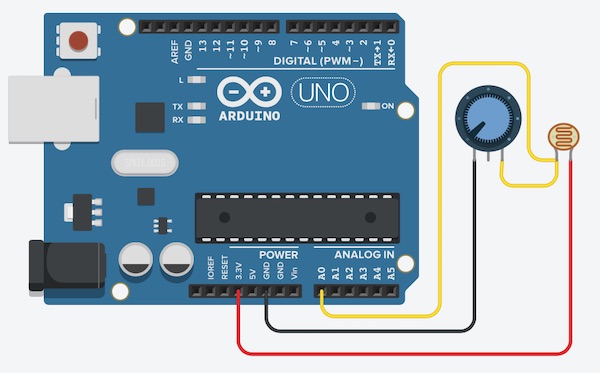
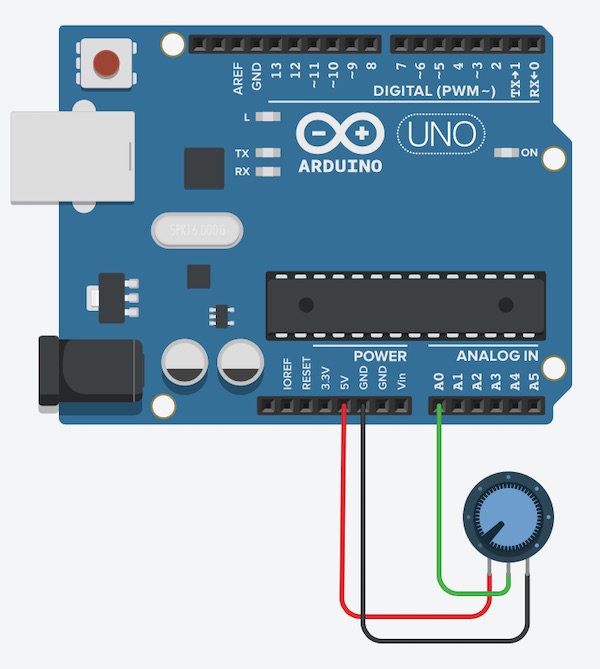
To read the changes in the sensor, the easiest circuit to build is a simple voltage divider, which I did with the 10kΩ potentiometer we were given in our “Quarantine Kit”. I put the light sensor between 3.3V and one side of the pot, and tied the other side of the pot to ground. I then connected the pot/sensor junction to pin A0 of the Arduino, as shown below using TinkerCAD.
The Arduino sketch looked like this:
int zero;

void setup() {
  // put your setup code here, to run once:
  Serial.begin(9600);
  Serial.println("running");
  zero = analogRead(A0);
}

void loop() {
  // put your main code here, to run repeatedly:
  int x = analogRead(A0) - zero;
  Serial.print("light\t");
  Serial.print(x);
  Serial.print("\n");
}
The Arduino sketch is available for download here.
Autocalibrate on setup
In the setup function, I’ve read the startup state of the light sensor and then used that to “tare” the readings in the main loop. This way the data output by the serial commands start at zero and there’s no big jump in the data when I display it.
Data display in LabVIEW
The data were transmitted to the LabView UI:
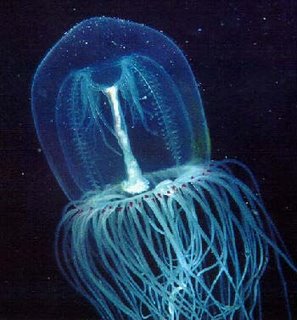
In the first segment, I’ve shaded the sensor with my hand and the signal goes positive, indicating that the resistance in the sensor is falling (the division point of the voltage divider gets closer to the positive rail). Then I shine a flashlight on the sensor and the signal goes negative (ie the resistance increases). Finally I wave my hand toward and away from the sensor and it acts as a kind of proximity sensor (shadow detector). Interestingly the jellyfish I studied in my PhD thesis use a very similar arrangement to detect when they might be going to be eaten: at the base of each tentacle (red spots in the photo below) there is a light sensor which responds to changes in light level by effectively changing the voltage of its membrane.
Interface 3: Arduino -> Processing
The objective in this section is to receive data from the Arduino and do something interesting with it on the computer. The tool selected for this task is Processing on the Mac and the Arduino IDE to program the Uno.
Arduino measurements
The first step is to create a sketch for the Arduino to output a value proportional to the change in state of an input device. The simplest device is the potentiometer, which I connected to the Arduino as shown below:
The sketch simply reads the analog input and outputs it to the serial port:
void setup()
{
  Serial.begin(9600);
}

void loop() {
  // read analog input, divide by 4 to make the range 0-255:
  int analogValue = analogRead(0)/4;
  Serial.write(analogValue);
  // pause for 10 milliseconds:
  delay(10);
}
We fought with this for a lot longer than we should have before we finally got it to work. The problem was that originally, instead of the Serial.write command, we used Serial.println, which resulted in a string of characters instead of a byte, and that caused all kinds of trouble at the computer end. Once we switched to Serial.write, all was quickly resolved.
Reading with Processing
The Processing environment is easy to use, in particular as it was the basis for the Arduino IDE, so the structure is familiar. The objective was to control a display on the computer whose shape would change depending on the potentiometer setting. Our instructor recommended a fractal tree, which was provided in one of the examples in Processing. We combined that with parts of another example which reads the serial port.
Reading the serial port
The first step in the code is to find the relevant serial port, which is done by first reading the list of all available ports and selecting the one the Arduino is connected to. The code to do this is:
import processing.serial.*;

Serial myPort;  // The serial port

void setup() {
  // List all the available serial ports
  printArray(Serial.list());
  // Open the port you are using at the rate you want:
  myPort = new Serial(this, Serial.list()[3], 9600);
}
The output of the program into the Processing console was:
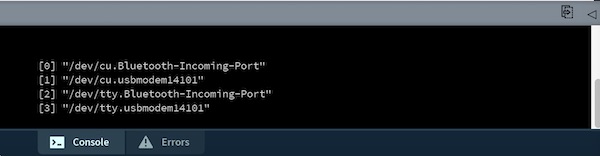
The Arduino was connected to the usbmodem, so the myPort parameter was set to Serial.list()[3], the last one in the list, as shown in the code snippet above (it didn’t matter for the purposes of this exercise whether I selected port 1 or port 3).
Once the port was initialised, the code required to read the byte from the Arduino was:
void draw() {
  while (myPort.available() > 0) {
    int inByte = myPort.read();
    println(inByte);
  }
}
The important element here was the “int” before inByte. The println statement just outputs the value to the console for debugging.
Printing the tree
I used the example code in Processing from the “Fractals and L-Systems” to generate the fractal tree. Most of the details of the sketch used are not important for this assignment, but for information, the entire sketch is available here.
Integrating input and output
The modifications to the example code are all at the top of the file:
...
import processing.serial.*;
Serial myPort;  // The serial port

void setup() {
...
  printArray(Serial.list());
  myPort = new Serial(this, Serial.list()[3], 9600);
}

void draw() {
  int inByte = 0;
    while (myPort.available() > 0) {
      inByte = myPort.read();
    println(inByte);
  }
...
float a = (inByte / (float) width) * 90f;
...
The first two lines import the library and set up the port pointer. The first two lines of the setup function then open the appropriate port, as determined earlier. Next the Arduino output is read into the variable inByte. Important here to note that the variable had to be declared outside the while loop so that it would be available later. The final step was to set the tree shape parameter “a” based on “inByte”.
The result is as follows:
There was lots of celebration around the Zoom screen when that “just worked”!
Interface 4: A javascript UI
The second objective this week was to build a user interface to a graphics program. This section of the assignment isn’t about the interface with the microcontroller, but rather with the user.
Getting started
I’m looking to make a multiple choice exam system to train myself to identify the lights and sounds of ships in reduced visibility. It’s part of what will eventually be an AI system in an autonomous surface vessel my students and I are revamping in the lab.
Called NavLights, the program is designed in javascript to run directly in the browser. The first step is to get javascript working in my localhost. Following a quick tutorial online, I created the following simple html file:
<!DOCTYPE html>
<html lang="en-US">

<head>
    <meta charset="UTF-8">
    <meta name="viewport" content="width=device-width, initial-scale=1">
    <title>Today's Date</title>
</head>

<body>

  <script>
      let d = new Date();
      document.body.innerHTML = "<h1>Today's date is " + d + "</h1>"
  </script>

</body>

</html>
The file worked exactly as advertised to show today’s date. Then I edited the file to switch to an include version, so that the script could be placed in a file of its own. I put the code in the subdirectory /js of my website, and reworked the code so:
<!DOCTYPE html>
<html lang="en-US">

<head>
    <meta charset="UTF-8">
    <meta name="viewport" content="width=device-width, initial-scale=1">
    <title>Today's Date</title>
</head>

<body>

</body>

<script src="js/script.js"></script>

</html>
The script file, js/script.js looks like this:
let d = new Date();
document.body.innerHTML = "<h1>Today's date is " + d + "</h1>"
Nice and simple. When I ran the code on my local host, it worked fine. I then uploaded it to git in the usual way, and you can see the result here
Math graphics display in 3D
I’ve chosen the threejs library that Neil showed us in class. I downloaded the library, then installed the three.min.js script file into my /js directory. Then I copied the content of Neil’s demonstrator onto my website. The result of that is here or below in an iframe.
Now that I’m happy that’s all working, I’ll start on the Navigation lights application.
NavLights
The objective of this little project is to build a navigation lights simulator using javascript. Here are the steps I followed to get that working.
The project main page is here.
The application can be reached here. Here’s it working in an iframe:
The Display
The threejs library is really easy to use. Basically there are three elements to setting up the display:
- Set up the scene
- Set up the renderer
- Set up the camera
Scene
The scene is where all of the excitement happens. One first sets up a new scene with the code:
var scene = new THREE.Scene();
Elements are added to the scene in functions after that. Here, for example is the code for the stern light:
var sternLight = function(x,y,z,colour) {
    var geometry = new THREE.SphereGeometry(1,32,32,113*Math.PI/180,135*Math.PI/180);
        geometry.translate(x,y,z);
    var material = new THREE.MeshBasicMaterial( { color: colour } );
        material.side = THREE.FrontSide;
    var sphere = new THREE.Mesh( geometry, material );
    scene.add( sphere );
    }
The geometry line sets up the shape of the sphere. The first parameter is the diameter of the sphere, the next two determine the resolution of the surface mesh, and the last two allow for only part of the sphere to be rendered. In this case, the stern light must be visible from 67 degrees either side of the ship’s centerline when viewed from astern. The translate method then places the centre of the sphere appropriately in the scene. The center of the scene is defined here to be coincident with the centre of mass of the boat.
The material line specifies the colour and other texture features. In this case since I’m looking for a simple monochromatic light, there’s not much to include. What is important here though is to decide which side of the sphere will “shine” - hence the .FrontSide or .BackSide property.
The sphere is then added to the scene using the last two lines.
Similar functions are included to draw the other lights and a line mesh of the boat’s hull.
Renderer
The canvas on which the whole thing takes place is set up using the following code:
var renderer = new THREE.WebGLRenderer();
    renderer.setSize( window.innerWidth/2, window.innerHeight/2 );
    document.body.appendChild( renderer.domElement );
The second line sets the size of the canvas, and the third puts it into the webpage. It ends up in the webpage exactly where the <script> element appears in the HTML.
At the end of the script, the renderer is called using the following code:
function animate() {
    requestAnimationFrame(animate);
    renderer.render( scene, camera );
    }
animate();
This is basically the “while” loop which keeps checking for user input on the elements of the html page, each of which has a function call built into it. More on that later.
Camera
The camera is set up with the following code:
var camera = new THREE.PerspectiveCamera( 45, window.innerWidth / window.innerHeight, 1, 500 );
    camera.position.set( x, elevation, z );
    camera.lookAt( 0, 0, 0 );
The first line sets up the type of camera (there is an orthotic camera as well, but it doesn’t look as nice), the display area, and the depth of field. Objects less than 1 unit from the camera or more than 500 units away from it will not be displayed. The lookAt property turns the camera to center on a particular point in the scene, as if the operator were travelling with the panning platform and pointing the camera independently.
In the functions called by the buttons below the canvas, it was important to set both the position of the camera and the direction it was pointed in:
var cameraY = function(dE){
    elevation += dE;
    camera.position.set(x,elevation,z);
    camera.lookAt(0,0,0);
    }
Controls
For the moment, the viewport is controlled by six HTML buttons displayed below the canvas. Each of these calls a function in the javascript code. A typical call looks like this:
<button onclick="drawBoat(0x0000ff)">DrawBoat</button>
Upgraded controls
To upgrade the controls from the plain buttons, I’ve implemented the dat.gui library. The controls are now built into the javascript instead of being outside in the html page. This required the following modifications:
- To the <head> element, I added:
<meta name="viewport" content="width=device-width, initial-scale=1.0, maximum-scale=1.0, user-scalable=no">
which sets up a place on the screen to put the control panel.
- To the top of the <body> element, I added:
<script type="text/javascript" src="js/dat.gui.js"></script>
and naturally I also copied the dat.gui.js library to the js folder.
- To the end of the script, I added the guts of the control panel:
    var showFrame = false; // keep track of whether the frame is visible

    var obj = {
        message: 'Hello World', // for use later
        showBoat: function () {
            if (showFrame) {
                drawBoat(0x000000);
                showFrame = false;
            }
            else {
                drawBoat(0x0000ff);
                showFrame = true;
            }
        },
        reportElevation: elevation,
    };

    var gui = new dat.gui.GUI();

    gui.remember(obj);

    gui.add(obj, 'message');
    gui.add(obj, 'showBoat');
    gui.add(obj, 'reportElevation').listen();
The trick here was to use the showBoat function as a method in the obj object. When the user clicks on the showBoat button on the control panel, the showBoat function is called, which in turn calls the drawBoat function to draw the frame in blue to show it or black to hide it.
The reportElevation element provides information about the position of the camera. The elevation is still controlled by the external <button> elements in the HTML, but the value of the elevation variable is displayed here. Key to this was the .listen() method in the gui.add declaration. This listened for changes to the elevation variable, which is changed inside the animate function:
function animate() {
    requestAnimationFrame(animate);
    renderer.render( scene, camera );
    obj.reportElevation = elevation;
}
animate();
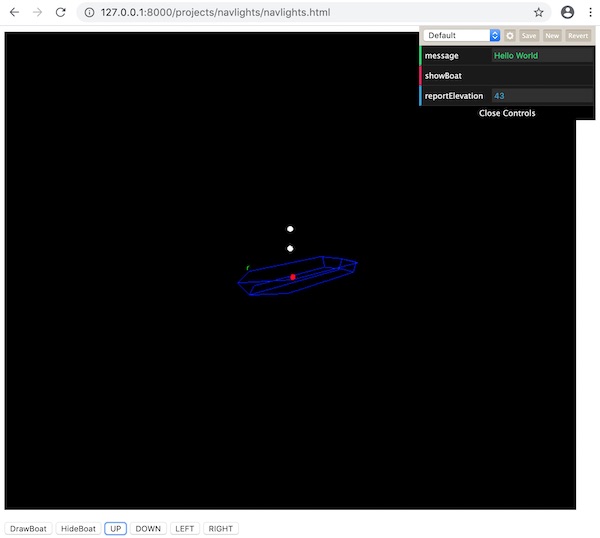
The result is now live on the website. Here’s a screenshot:
The next step will be to upgrade the user interface, then I’ll add a matrix to decide what lights should be turned on why what ships. Finally I’ll add a random number generator that will turn this into a multiple choice test.
Making a Quiz
The first step in making a quiz was to incorporate an array structure to pick specific types of boats to display. These were simply selected at random each time the page was called.
Multiple Boat Types
I modified the code to include a list of possible ship types and their corresponding lights. The list of ships is added to an array as follows:
        var boatDescription = [
            "SV <50m, U/sail",
            "MV <50m, U/way",
...
        ]
And the corresponding lights are added into a binary array with flags for each of the lights around the ship. I’ve started with 12 lights, but it’s quickly become obvious that I’m going to need more. Probably more like 16…
        var showLights = [
            //running lights
            //forward masthead light
...
            0b100000000000, // SV Under sail
            0b110000000000, // MV <50m Underway
...
        ]
Random number generator
Boat types were selected at random using:
var boatType = Math.floor(Math.random() * showLights.length);
The text in the control panel was adapted to show the type of vessel:
    var showFrame = false; // keep track of whether the frame is visible

    var obj = {
        message: boatDescription[boatType], // for use later
        showBoat: function () {
Software / Hardware Setup
Installing LabVIEW & Arduino compiler
All of the various software components to reproduce my work here are available for free online under evaluation licenses. The installation steps are:
(Windows) - Install LabVIEW 2019 SP1 Evaluation for Windows - Make sure to include NI-VISA and NI-Serial when prompted - Also include the VI Package Manager in the installation (separate installation on the Mac) - Using the VI Package Manager, add the “Digilent LINX” package and the “Arduino Compatible Compiler for LabVIEW” - Roll back your Arduino IDE to version 1.6.6. The compiler doesn’t work with later versions. - The rest runs within the menus of LabView
(Mac) - Install LabVIEW 2019 Evaluation for Mac - Use this link, not the usual NI download page, since that one has a bug which prevents the download starting. - Install NI-VISA 19.0 for Mac - Install the VI Package Manager for Mac - Use the Package Manager to install the “Digilent LINK” package.
Group Project
Our group project for this week can be found here